AgentSight Integrations
AgentSight observes Agents without being wired into them, and it shows data from the other ANOLISA components when they happen to be installed. Nothing on this page is required to use AgentSight.
Supported Agents
Any process matched by a discovery rule is traced. The shipped rule set (31 rules) covers:
| Agent | Reported name |
|---|---|
| cosh (Copilot Shell) | Cosh |
cosh-ng (cosh-shell, cosh-core, cosh-cli) | CoshNG |
| Claude Code | Claude |
| Codex CLI | Codex |
| Qwen Code | QwenCode |
| OpenClaw (gateway) | OpenClaw |
| Hermes | Hermes |
| AgentScope | AgentScope |
| Runloop Node server | Runloop |
Anything else works too — add a rule, as described in Agent discovery rules. Two details worth knowing:
- OpenClaw is observed through its
openclaw-gatewaydaemon, not the client. If Token data is missing, check that the client actually reaches the gateway. - Codex CLI statically links its TLS library, so AgentSight falls back to byte-pattern matching
and a per-version offset table. A brand-new Codex release may need a refreshed entry in
codex_offsets.
Tokenless: Token savings
With Tokenless installed, AgentSight shows how many Tokens compression actually saved — no configuration on either side:
- the Token Savings page compares actual consumption against the baseline, by optimization type;
- the
SAVED TOKENScolumn appears next to each session on the Agent Observability page; - the Trajectory Viewer shows original versus optimized Tokens for the loaded session;
agentsight summaryincludes a savings line;GET /api/token-savingsexposes the same numbers.
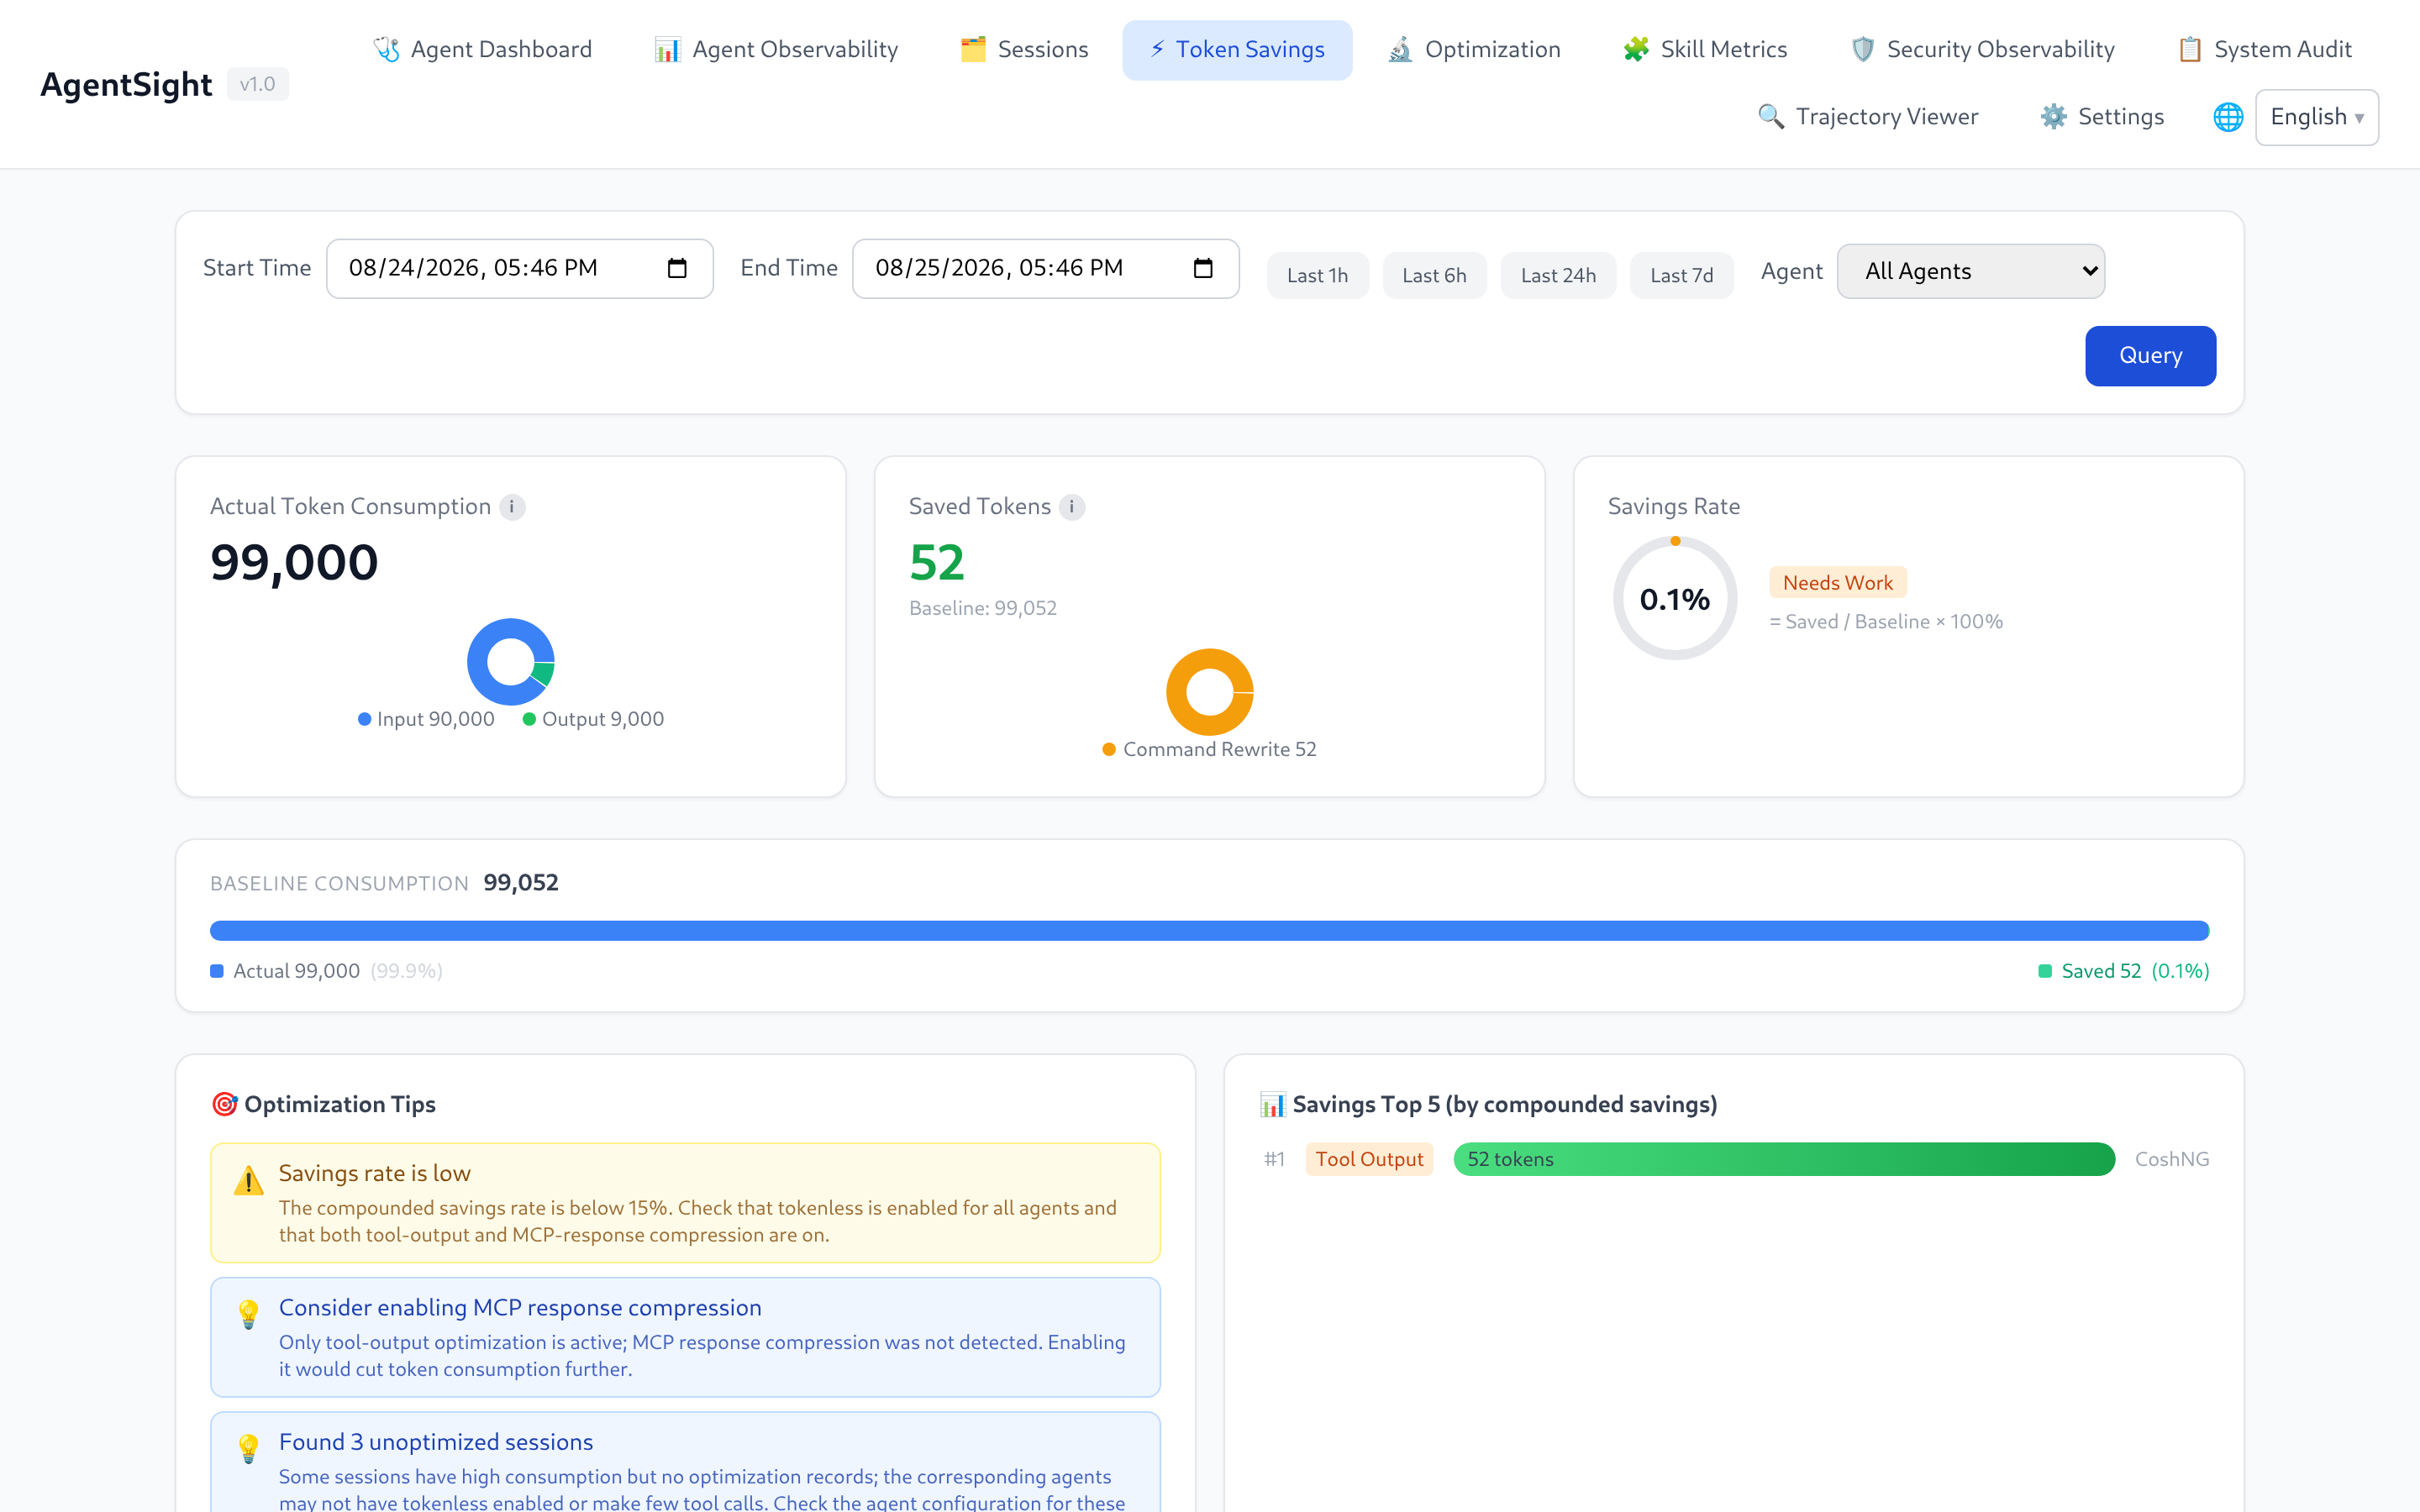
The page reads Tokenless's own statistics database, so numbers appear only after Tokenless has optimized something. A savings figure of 0 usually means Tokenless is installed but not active for the Agent that produced those sessions.
Savings association also requires AgentSight to capture and parse the corresponding output tool-call ID. Non-SSE HTTP/1.1 responses split across TLS reads are assembled using Content-Length or chunked framing before usage and tool calls are extracted. Oversized responses are discarded with a collector warning. Incomplete responses, including close-delimited responses without Content-Length or chunked framing, cannot supply complete usage or tool-call IDs; Tokenless stats can therefore remain unassociated. When SQLite storage is enabled, idle calls retain their request as pending evidence for interruption detection and can still complete if the response resumes. Response buffering remains bounded by the connection capacity and per-connection body limit.
agent-sec-core: security observability and audit
When agent-sec-core is installed, two more Dashboard pages appear:
| Page | Content |
|---|---|
| Security Observability | Prompt-injection, PII, and code-scan verdicts per session and per run |
| System Audit | Audit events aggregated into cases you can review, and contain when the enforcer is present |
AgentSight detects the component by its daemon socket or its CLI binary, so the pages stay reachable even while the daemon restarts.
One side effect worth knowing: agent-sec-core and Tokenless hooks run as short-lived helper
processes, and AgentSight records those too. They can dominate agentsight audit output — filter
them out with repeated --exclude:
sudo agentsight audit --last 1 --exclude agent-sec-cli --exclude observability_hook.py
agentsight-enforcer: risk enforcement
agentsight-enforcer is the privileged daemon that can block risky Agent actions. It ships with the
package and is started by agentsight-enforcer.service. When its socket
(/run/agentsight/enforcer.sock) is missing, serve logs:
AgentSight enforcement unavailable: enforcer I/O failed: No such file or directory (os error 2)
Capture and analysis are unaffected; only the Risk Enforcement page and the
/api/enforcement/* endpoints disappear. Start the unit, or build with make build-all if you
built from source.
The daemon itself logs to the journal — engine startup, socket bind, policy apply outcomes (including rollback detail when a kernel step fails), and poller errors:
$ sudo journalctl -u agentsight-enforcer
[INFO  agentsight_enforcer] agentsight-enforcer listening on /run/agentsight/enforcer.sock
The default level is info; add Environment=RUST_LOG=debug to the unit for verbose output.
cosh: ask in natural language
AgentSight ships a conversational Skill for cosh, so Token and audit questions can be asked in the terminal instead of through the CLI:
- "How many Tokens did I use today?"
- "Show me today's LLM calls"
- "Were there any interruptions in the last hour?"
Prometheus and Grafana
curl -s http://127.0.0.1:7396/metrics
/metrics is loopback-only by design. Scrape it with a node-local Prometheus agent (or a local
reverse proxy) using the counters agentsight_token_input_total, agentsight_token_output_total,
agentsight_token_total_total, and agentsight_llm_requests_total, all labelled by agent.
For richer panels, poll the JSON API instead — /api/timeseries for Token trends,
/api/metrics/latency for latency percentiles, /api/interruptions/count for open problems.
Trajectories for offline analysis
GET /api/export/atif/session/{id} returns an ATIF v1.7 trajectory containing prompts, tool calls,
results, and Token totals. Use it to feed evaluation pipelines, attach a reproduction to a bug
report, or import the session into another AgentSight instance through the Trajectory Viewer.
Related pages
- Configuration — add rules for your own Agent
- Dashboard guide — which pages appear when
- Data and storage — API details