AgentSight Dashboard Guide
The Dashboard is a web UI embedded in the agentsight binary. It reads the same SQLite databases
the tracer writes, so it needs no extra service. Default address: http://127.0.0.1:7396.
Start it
# local only (default)
sudo agentsight serve

# reachable from other hosts
sudo agentsight serve --host 0.0.0.0 --port 7396
The packaged agentsight.service already runs serve --host 0.0.0.0 alongside the tracer, so on a
normal install you only need to open the URL. Binding to 0.0.0.0 exposes the port on every
interface — restrict it in your firewall or cloud security group first.
Authentication
Token authentication is on by default.
| Access path | What is required |
|---|---|
http://127.0.0.1:7396 from the same host | Nothing; loopback requests skip authentication |
http://<host>:7396 from elsewhere | The Dashboard token, as ?token=<TOKEN> in the URL, as Authorization: Bearer <TOKEN>, or typed into the login form |
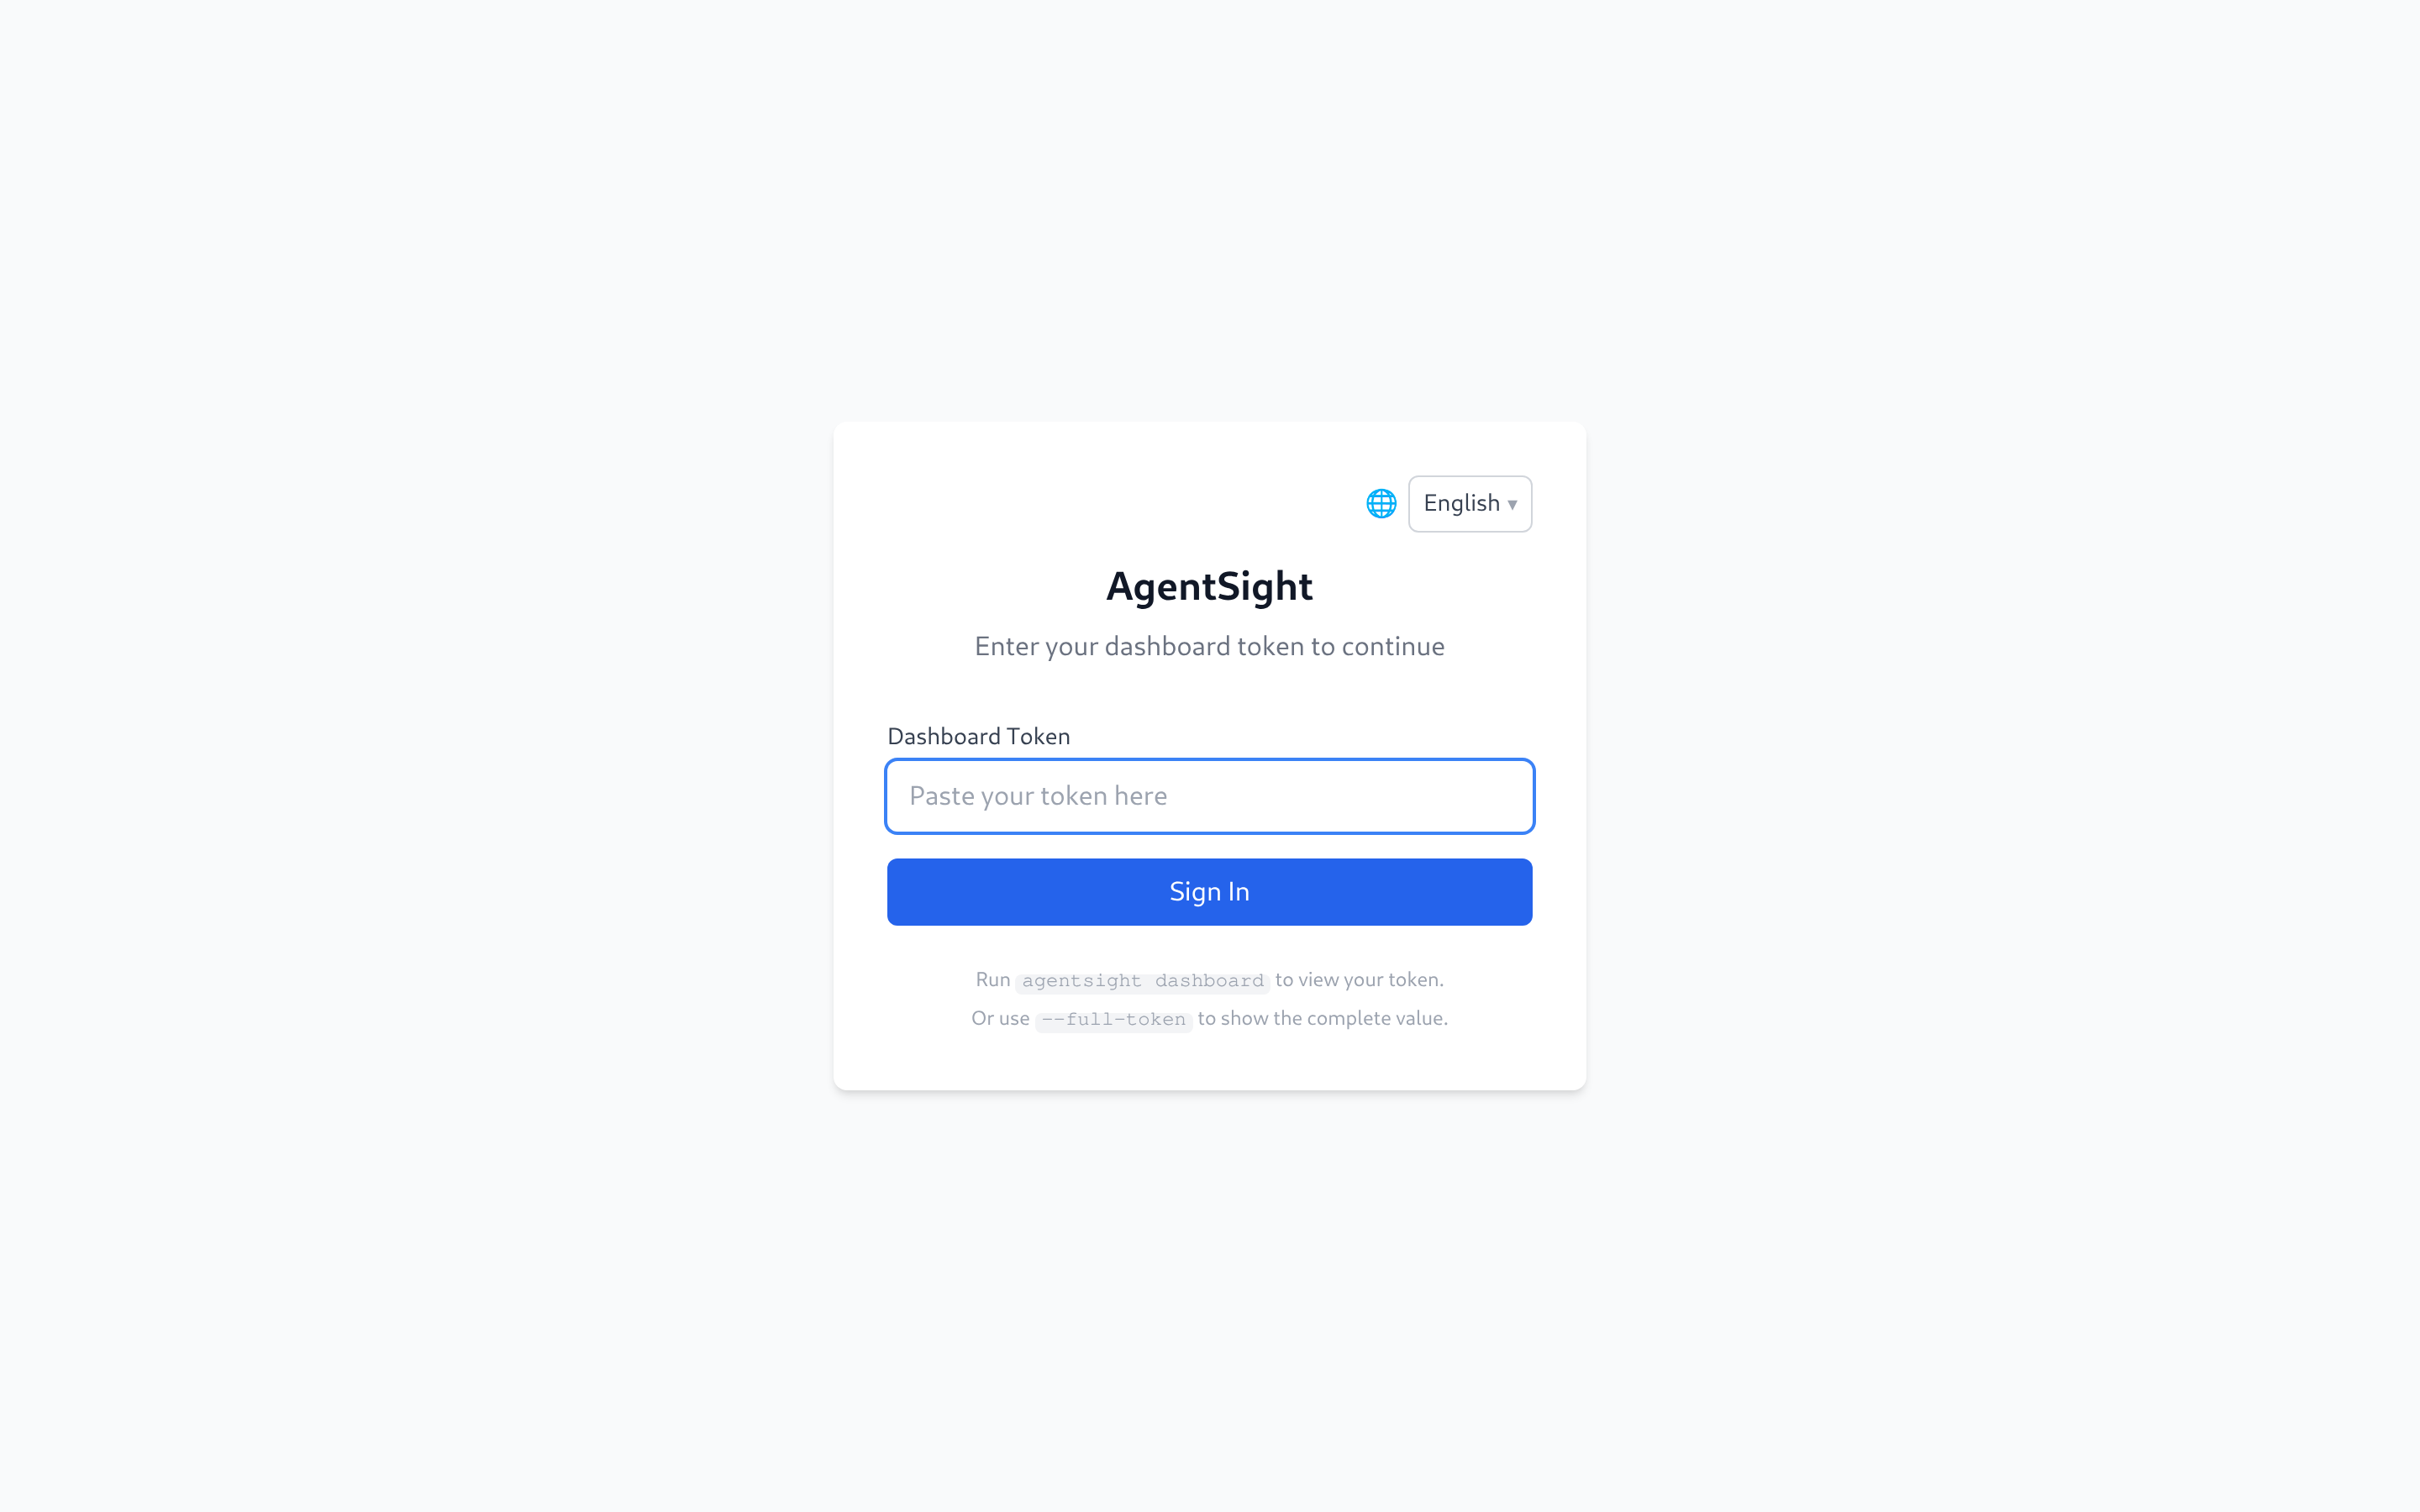
The token is generated on the first serve start (64 hex characters) and stored next to the
databases in /var/log/sysak/.agentsight/.dashboard_token. It is reused across restarts. Read it
with:
sudo agentsight dashboard --no-open
A successful login exchanges the token for an httpOnly session cookie, so you do not have to keep the token in the URL.
To turn authentication off — only sensible on a trusted internal network:
{ "server": { "auth": { "enabled": false } } }
sudo systemctl reload agentsight.service
sudo agentsight dashboard --no-openprints the complete token; the login screen links to that command.
Navigation and page availability
The navigation bar only shows pages the host can actually serve. AgentSight probes for companion
components on every page load and reports the result through GET /api/auth/status:
| Page | Appears when |
|---|---|
| Agent Dashboard, Agent Observability, Sessions, Reuse Labels, Optimization, Skill Metrics, Trajectory Viewer, Settings | Always |
| Token Savings | tokenless is installed, or its statistics database exists |
| Security Observability, System Audit | agent-sec-core is installed (daemon or CLI) |
| Risk Enforcement | agentsight-enforcer is installed or its socket exists |
So a Dashboard that shows fewer entries than this guide is not broken — the matching component is simply not installed.
A fresh visit to http://<host>:7396/ lands on the Agent Dashboard (#/health). The bare root
renders no page of its own: it redirects to the first entry in navigation order whose capability is
advertised, so a host that does not report agent_health lands on Agent Observability instead.
Agent Observability is reachable at #/observability, whether or not it is the landing page.
Most pages share the same header: a start/end time range with Last 1h / 6h / 24h / 7d shortcuts,
an Agent filter, and a Query button. Pages that show cost or savings figures wait for you to
press Query; the observability pages load the last 24 hours immediately.
Agent Dashboard
Live Agent health plus the interruption inbox: every unresolved event with its type, severity, session, and conversation. Resolve closes an event, Details opens the captured evidence. The latency panel switches between the last 24 hours, 7 days, and 30 days.
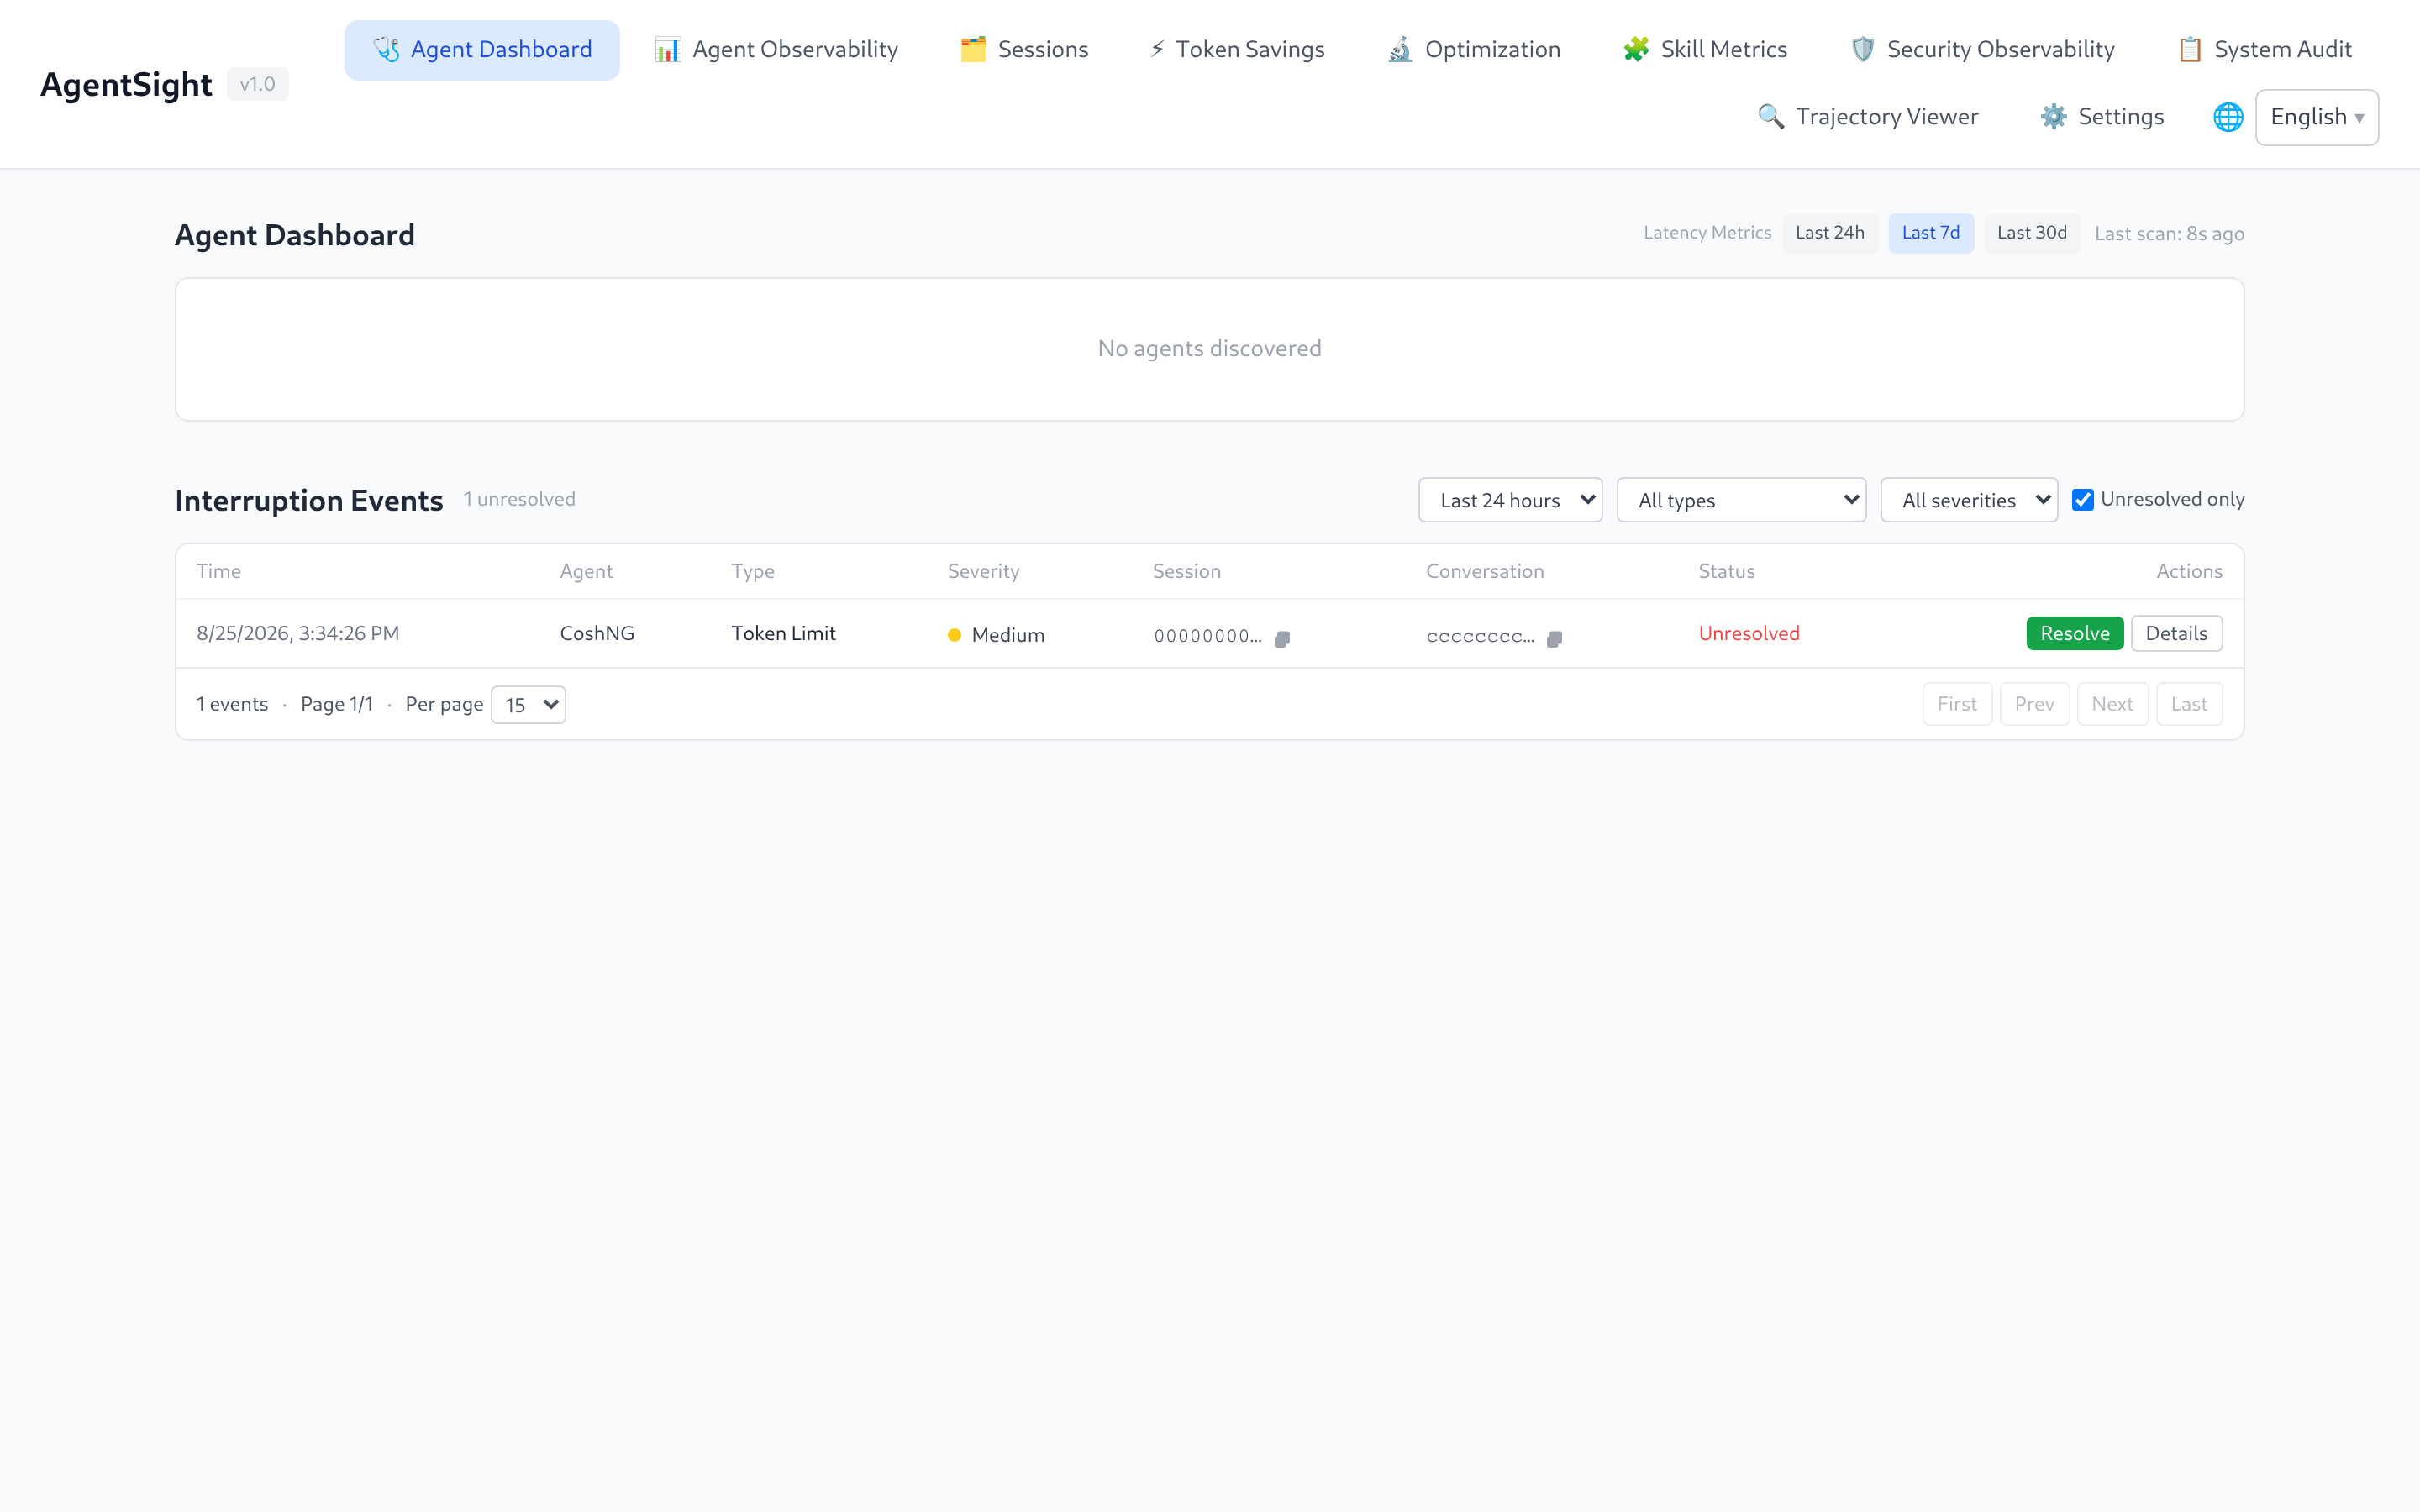
"No agents discovered" only means no Agent process is running right now; historical sessions stay visible on the other pages.
Agent Observability
The main analysis page: session count, input/output Tokens, interruption count by severity, Token time series (total and per model), and the session table.
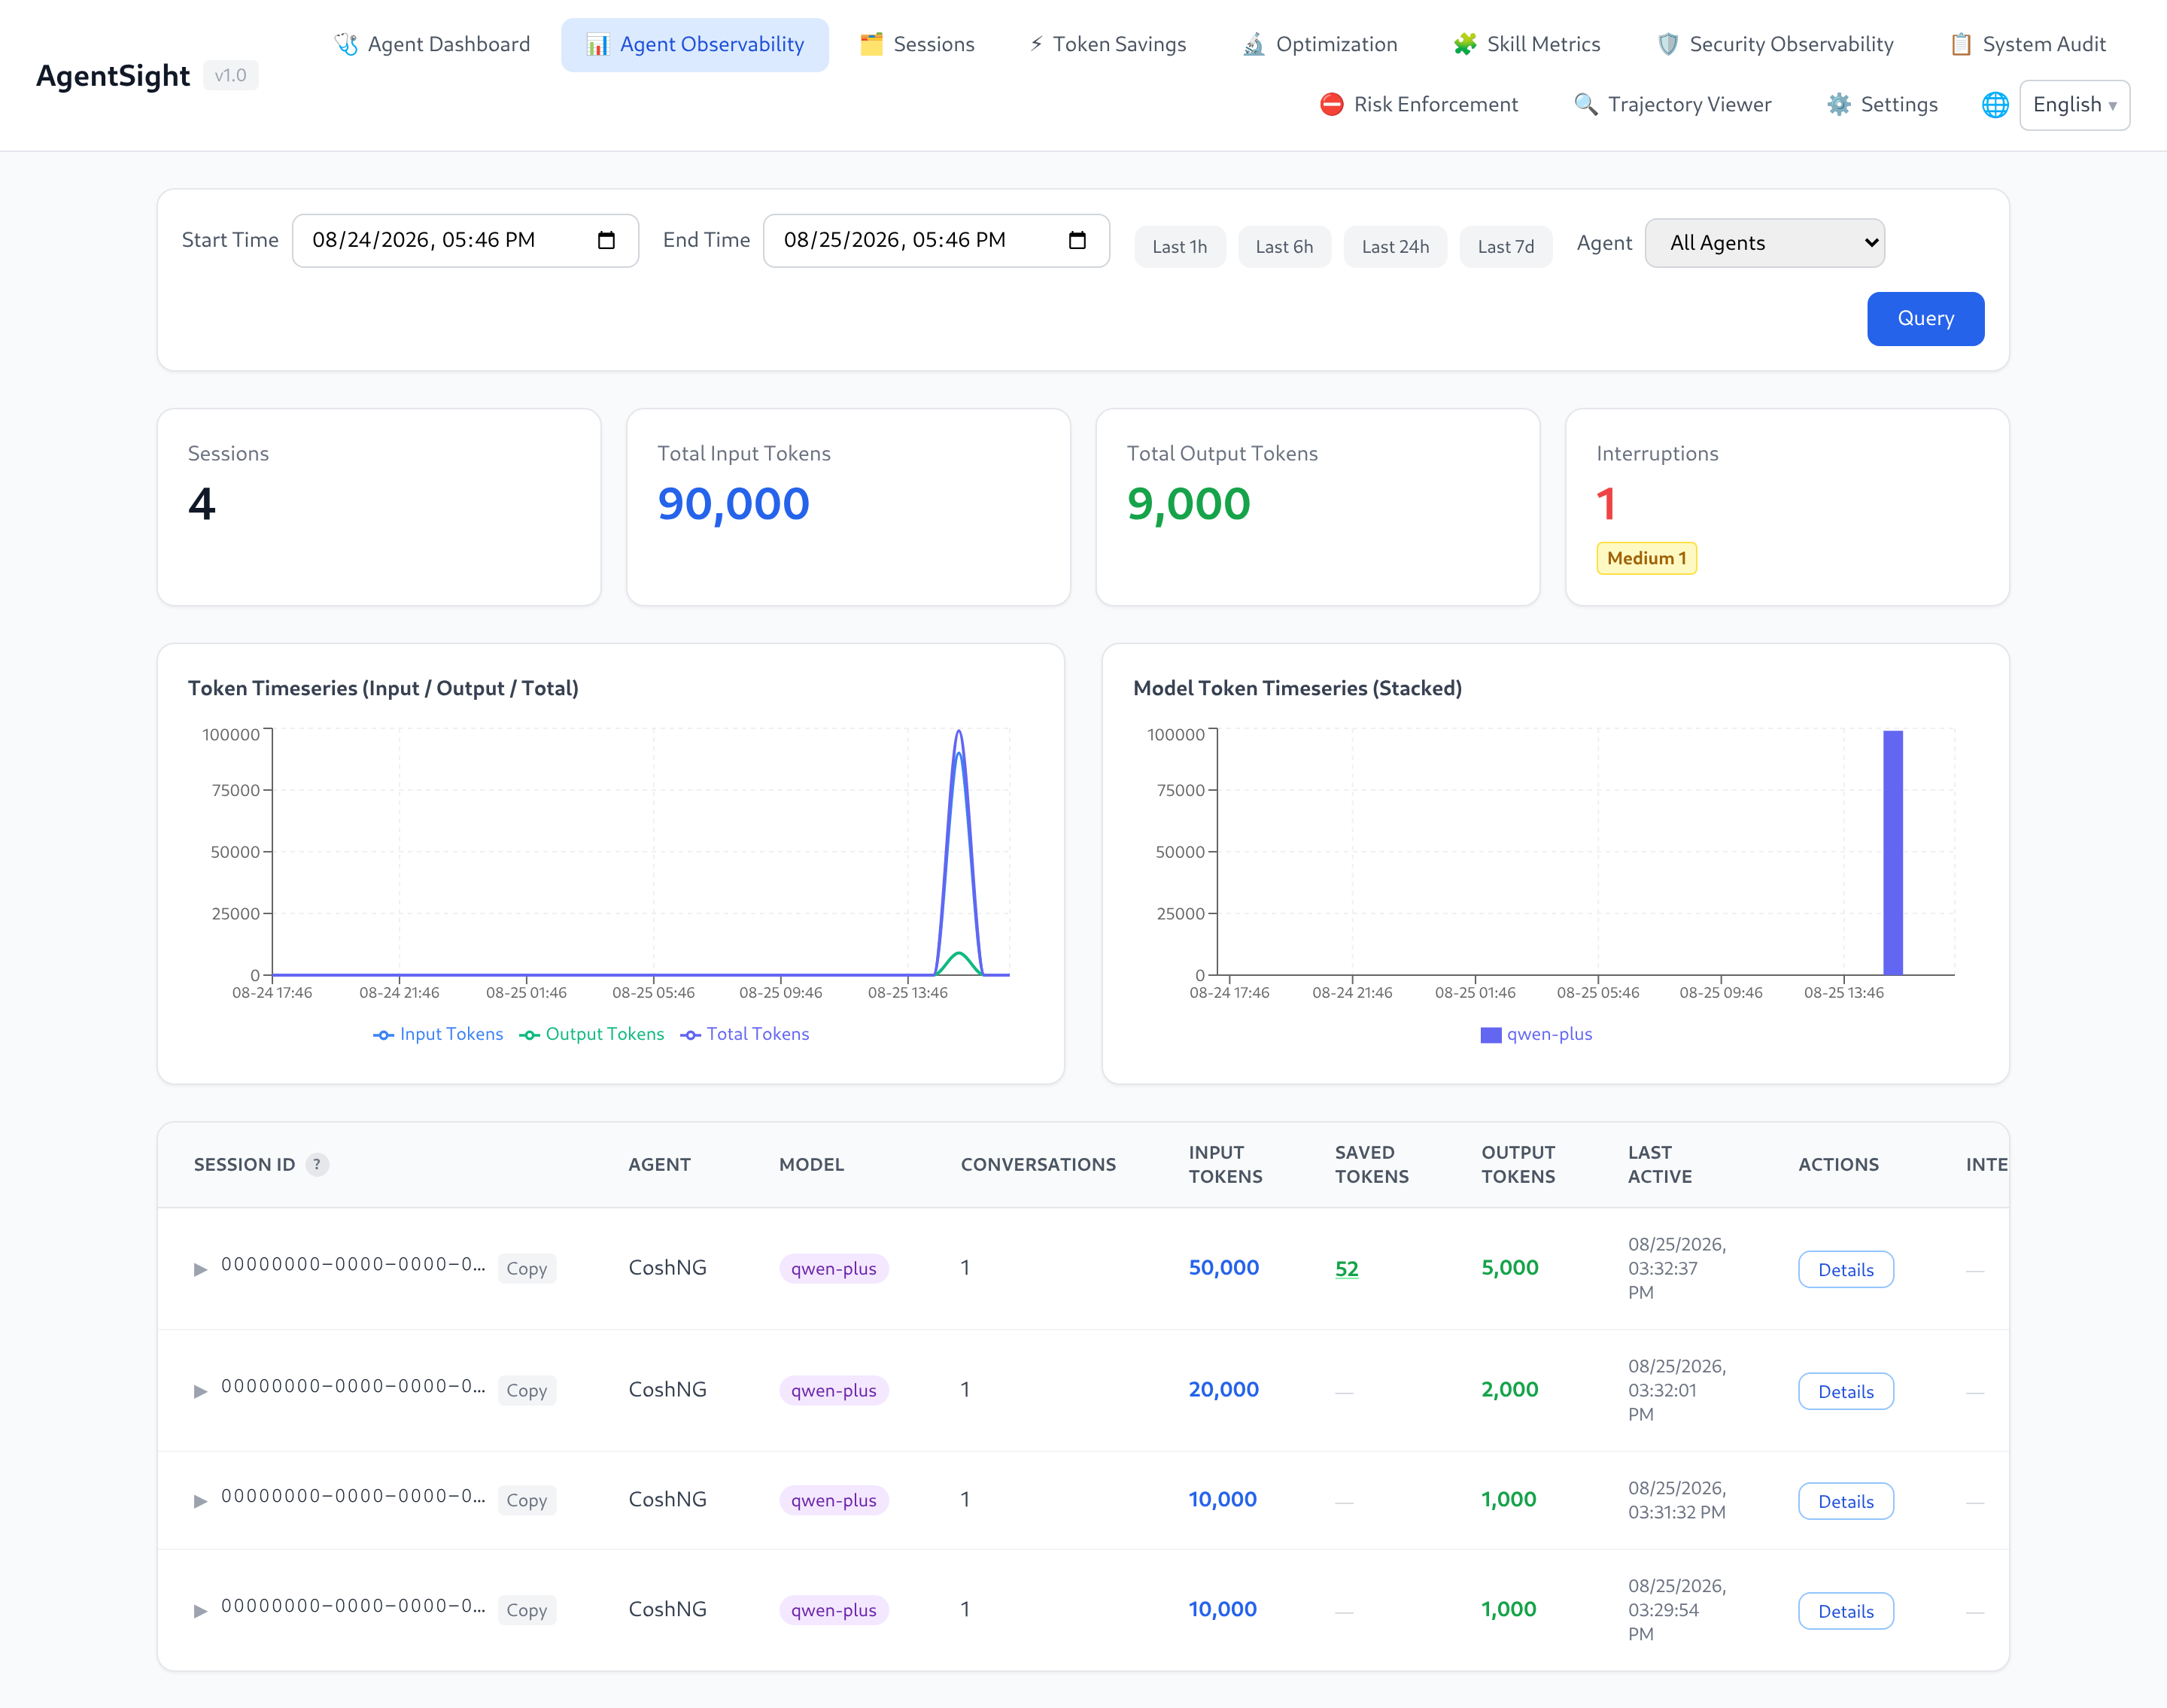
Click a session row to expand the conversations it contains. Each conversation row shows the user query, its Tokens, an interruption badge, and a quality Eval action:
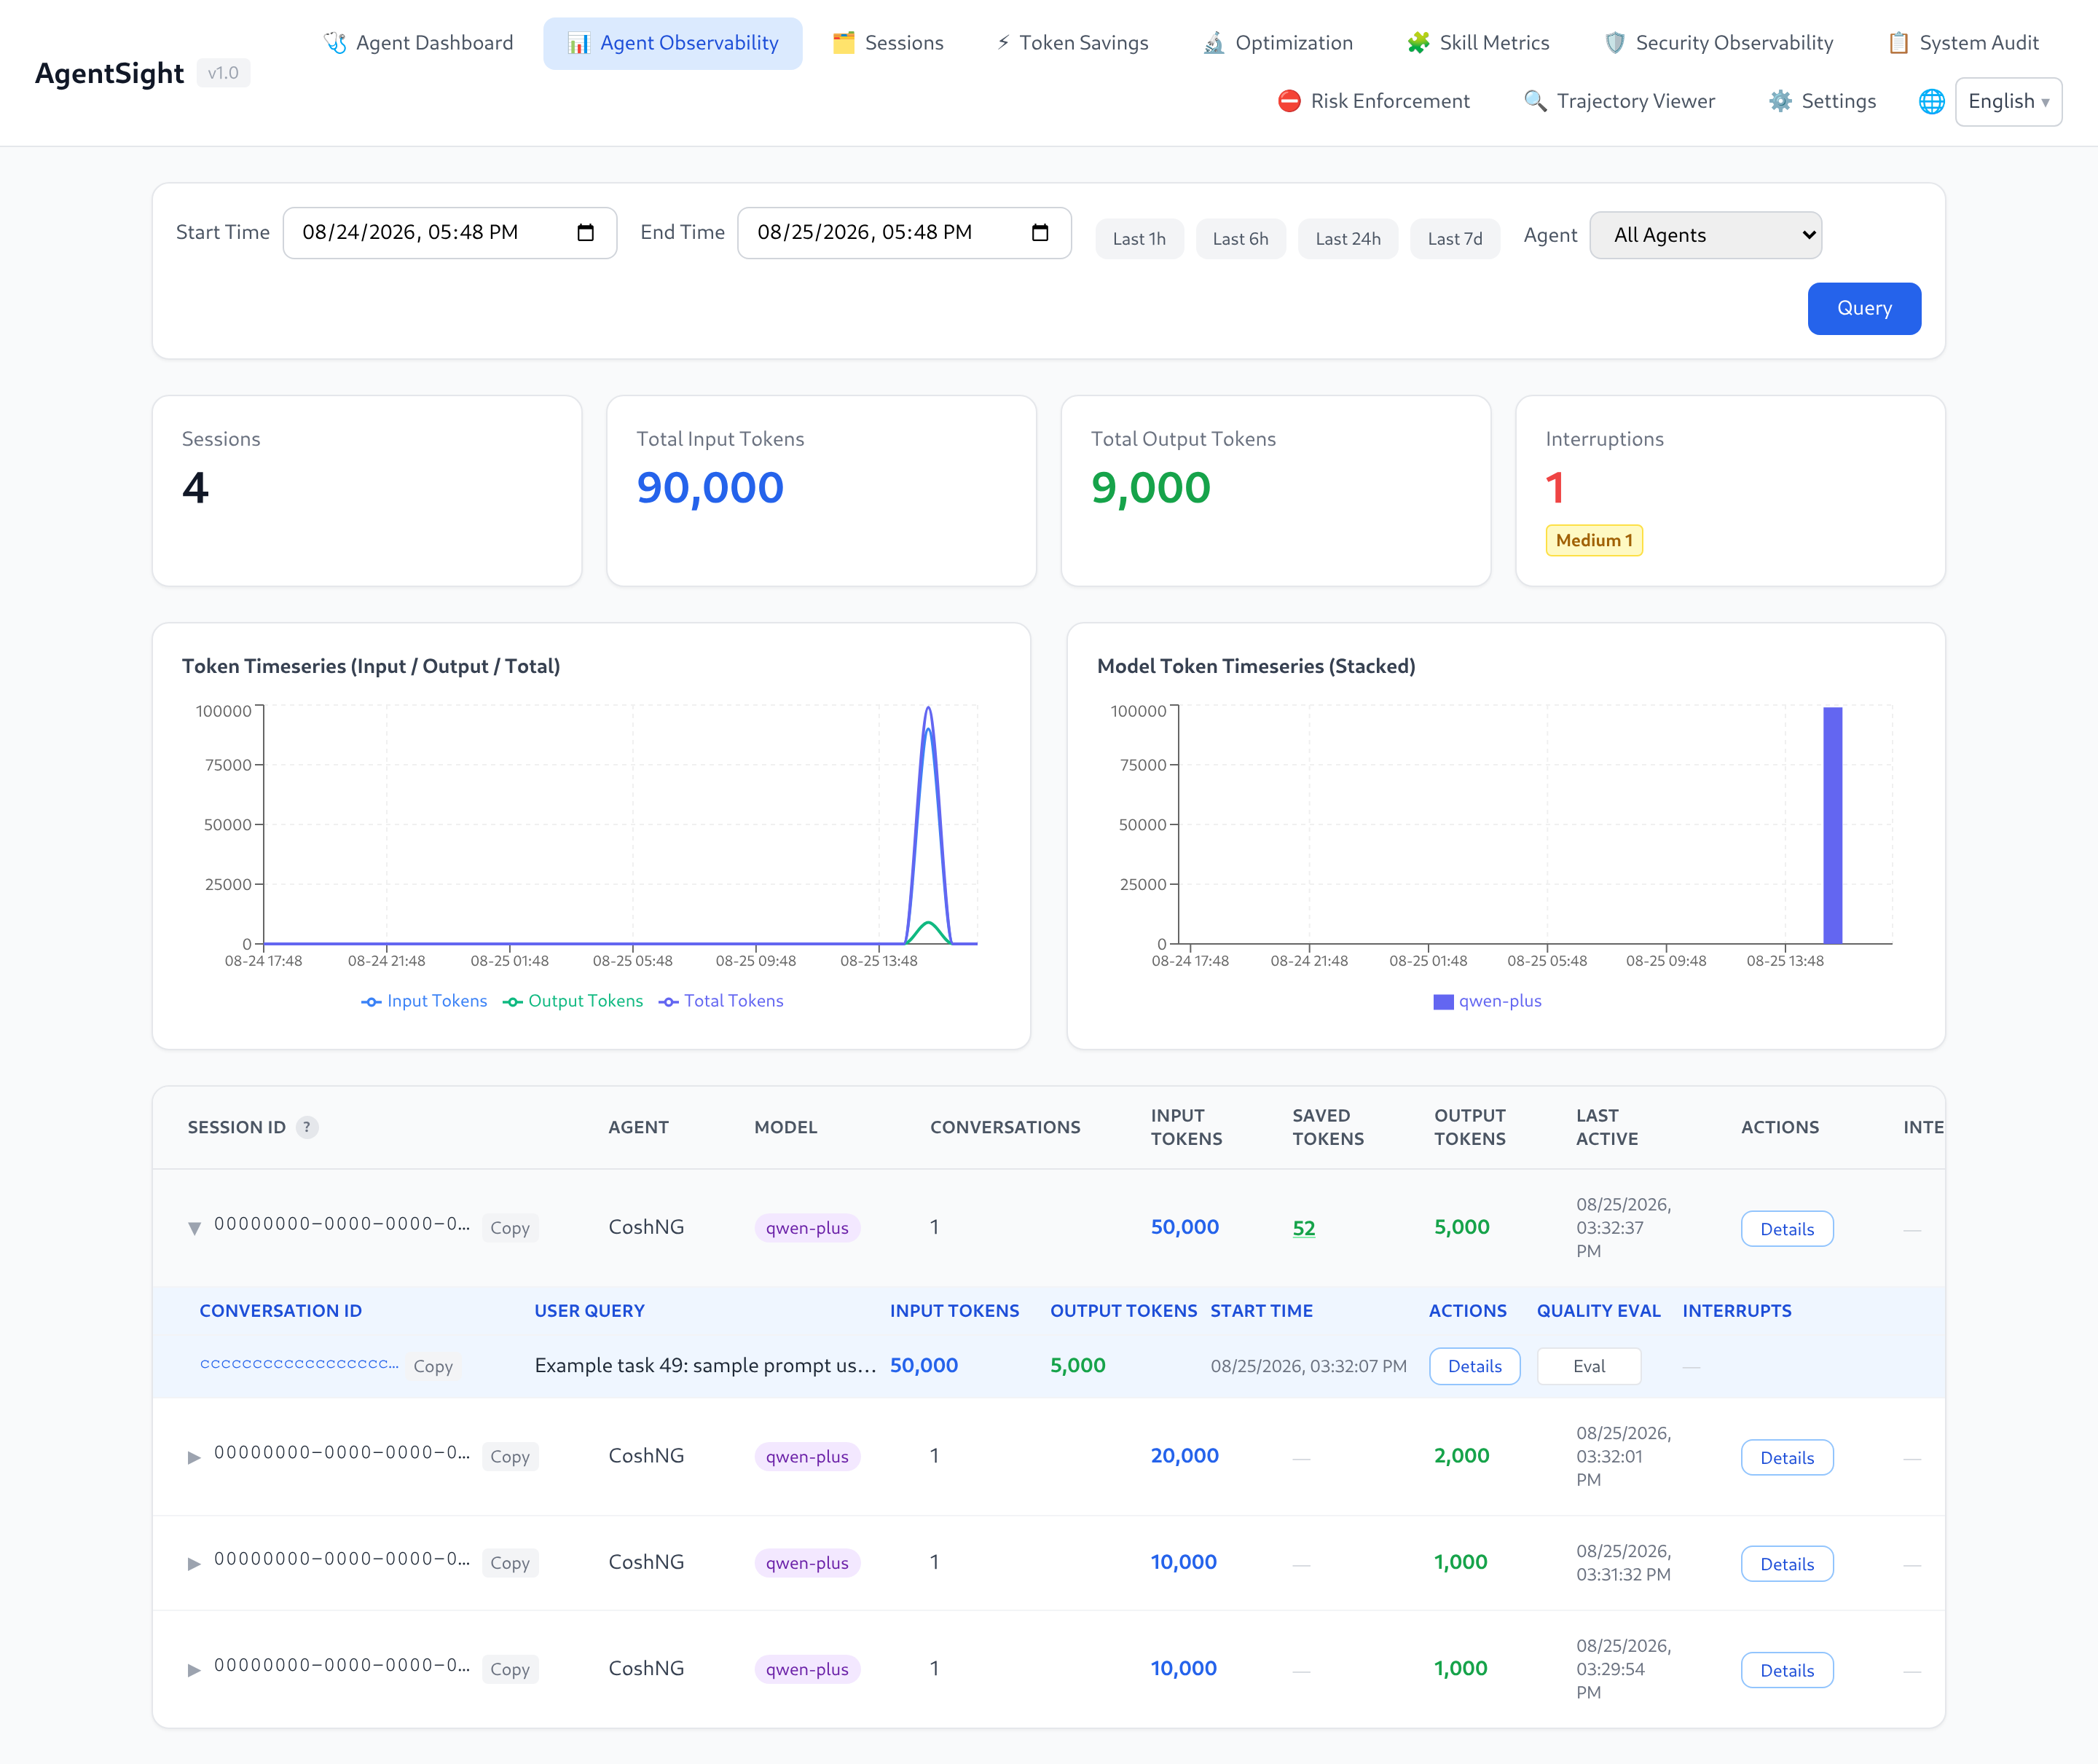
The expanded Session also shows CPU and RSS memory curves for its associated Agent processes. Blue background bands mark captured LLM calls, violet bands mark matched Tool Call intervals, and orange bands mark idle time between observed activities. Values from multiple associated PIDs are summed. The chart is process-level context, so a shared Agent process serving concurrent Sessions cannot be split into exact per-Session resource consumption.
The SAVED TOKENS column is filled in when Tokenless is active for that session.
Sessions
A session browser rather than a metrics page: filter by capture source (eBPF capture versus
Log collection), filter by Agent, or search sessions by meaning — the search uses the configured
optimization LLM to rank candidates by intent, e.g. "fix build error".
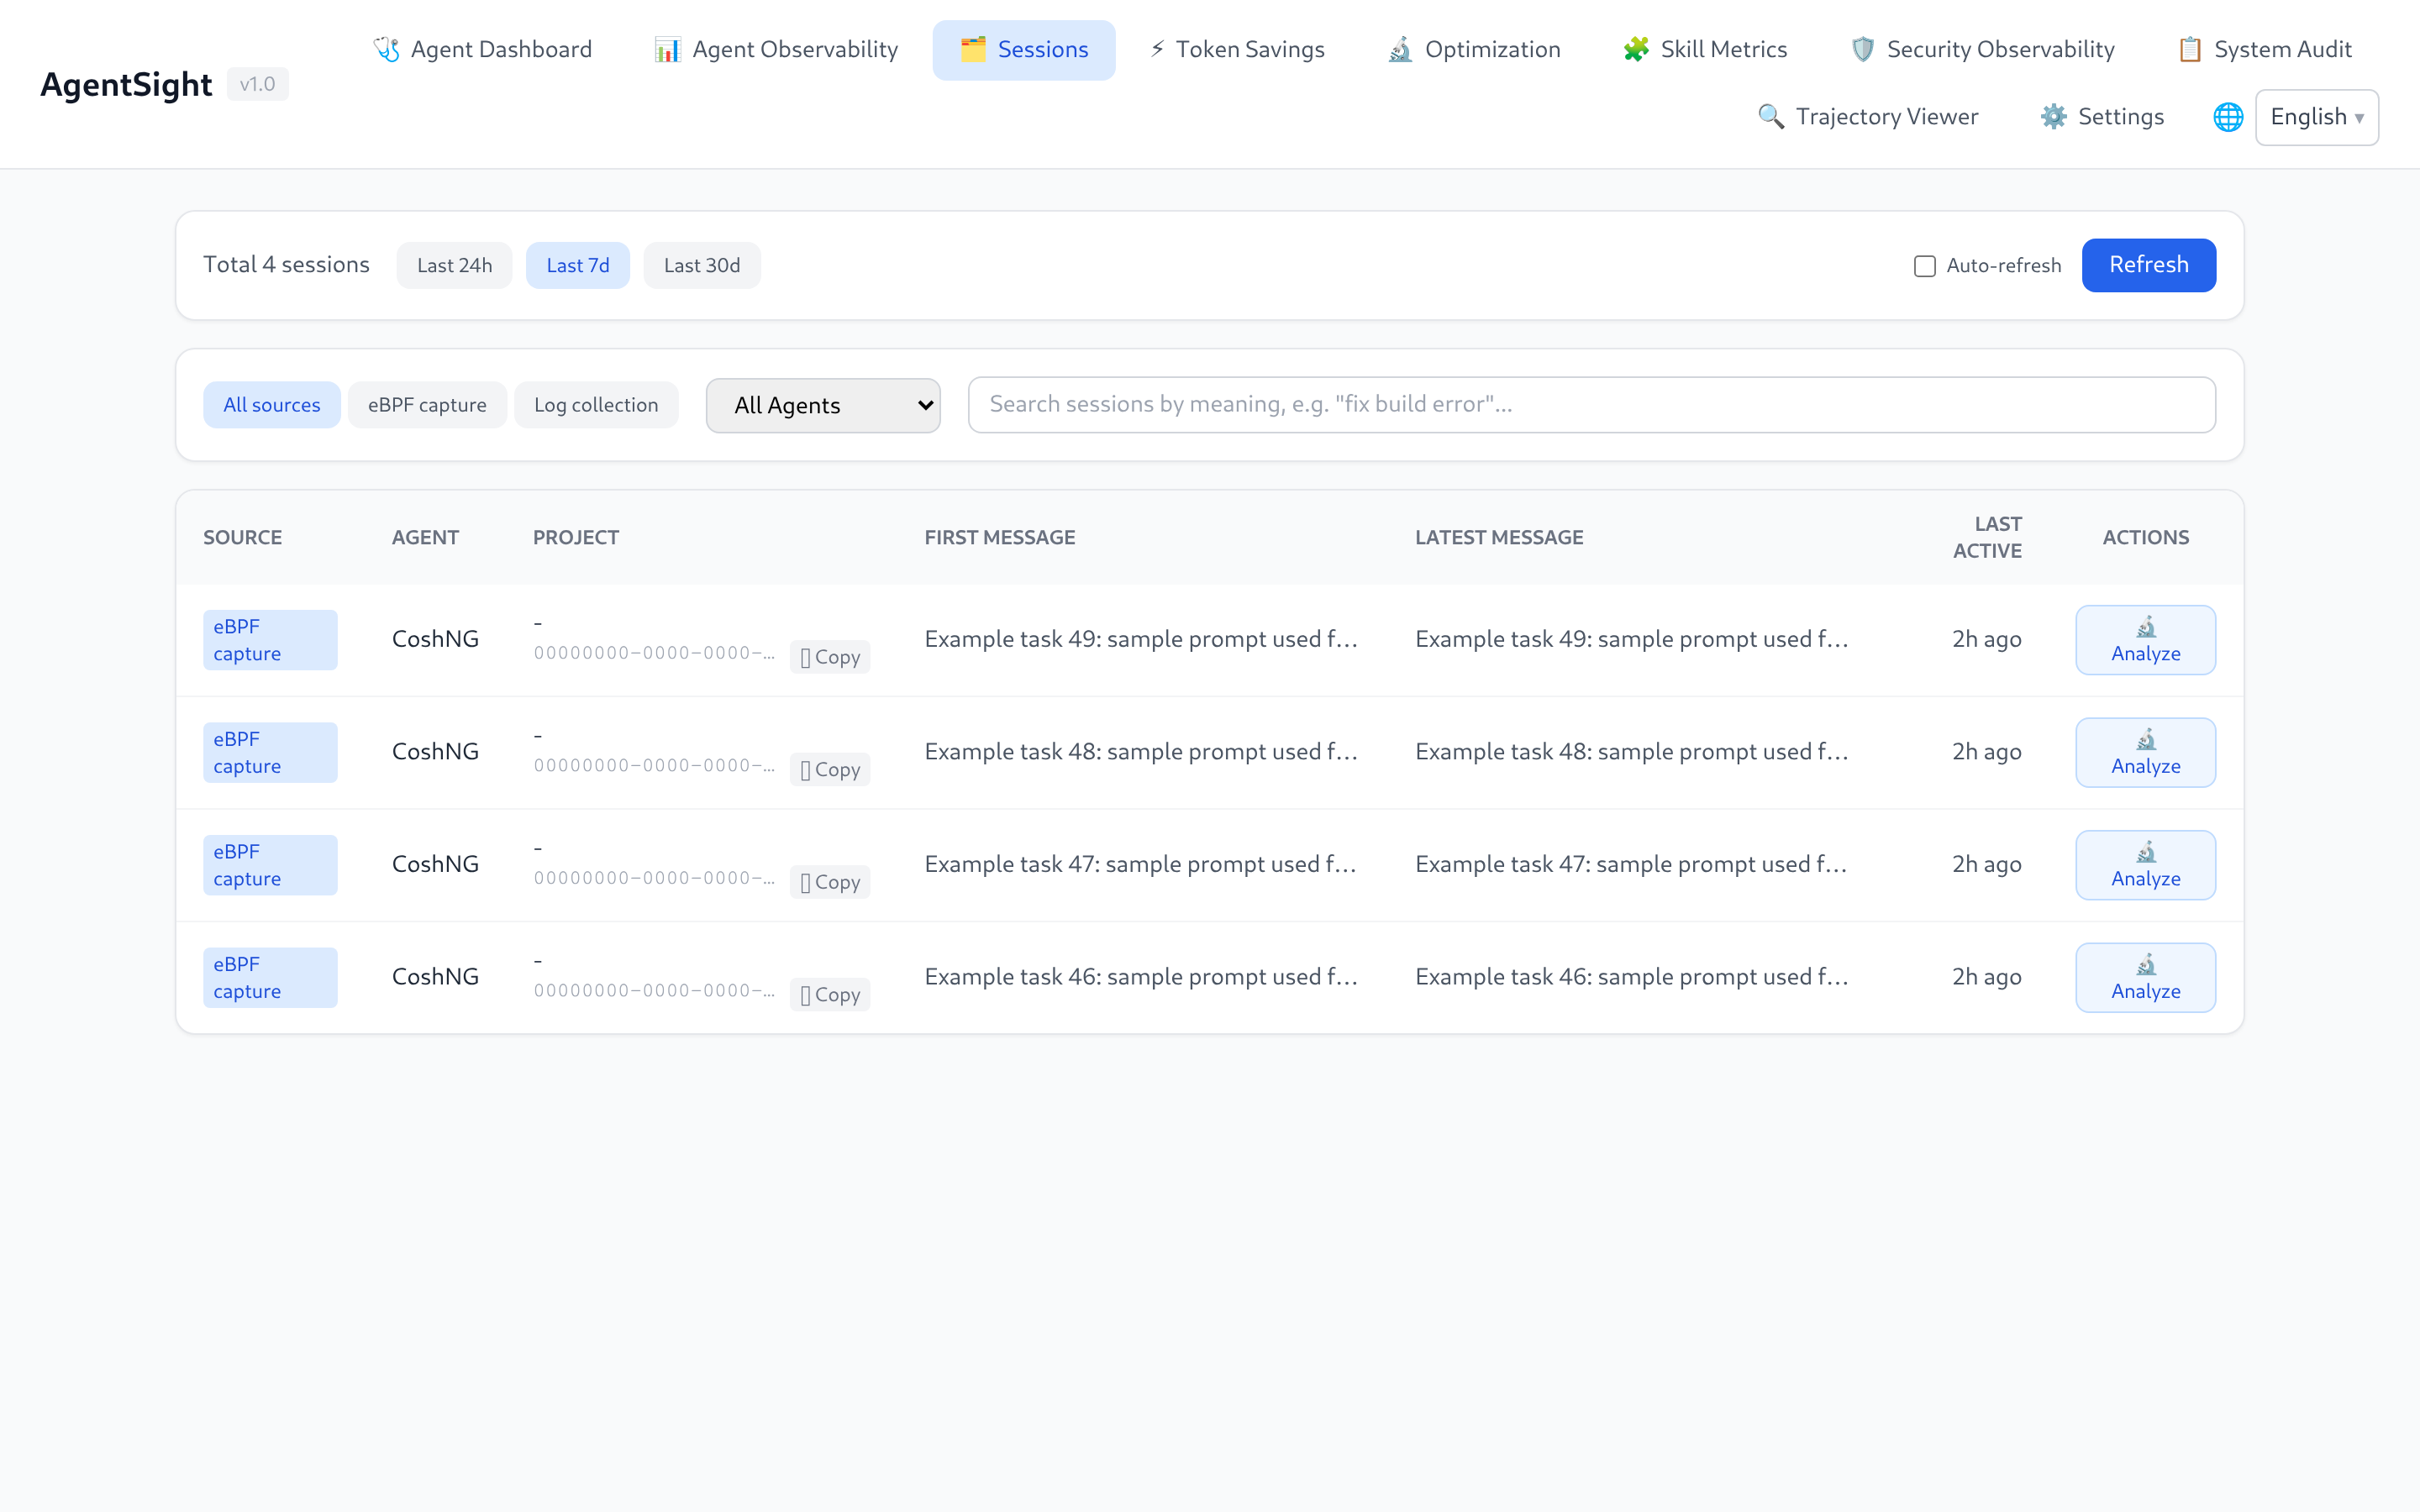
Analyze sends the session to the Optimization page.
Reuse Labels
Reviews collected trajectories for later Agent reuse. Run deterministic triage first, then confirm or override good, bad, useless, or unknown labels individually or in batch. The rules never assign bad; that verdict requires a human decision or an LLM judgement with a cited trajectory step.
The optional model judge is available only after enabling features.reuse_llm_judge and configuring an optimization LLM. It runs billed requests and reports batch progress while it works. The page is advertised through the always-present reuse_labels capability; if reuse.db is unavailable, it remains visible and explains that labels cannot be read.
Token Savings
Compares actual Token consumption against the baseline Tokenless would have consumed, broken down by optimization type, plus a savings ranking and concrete tips.
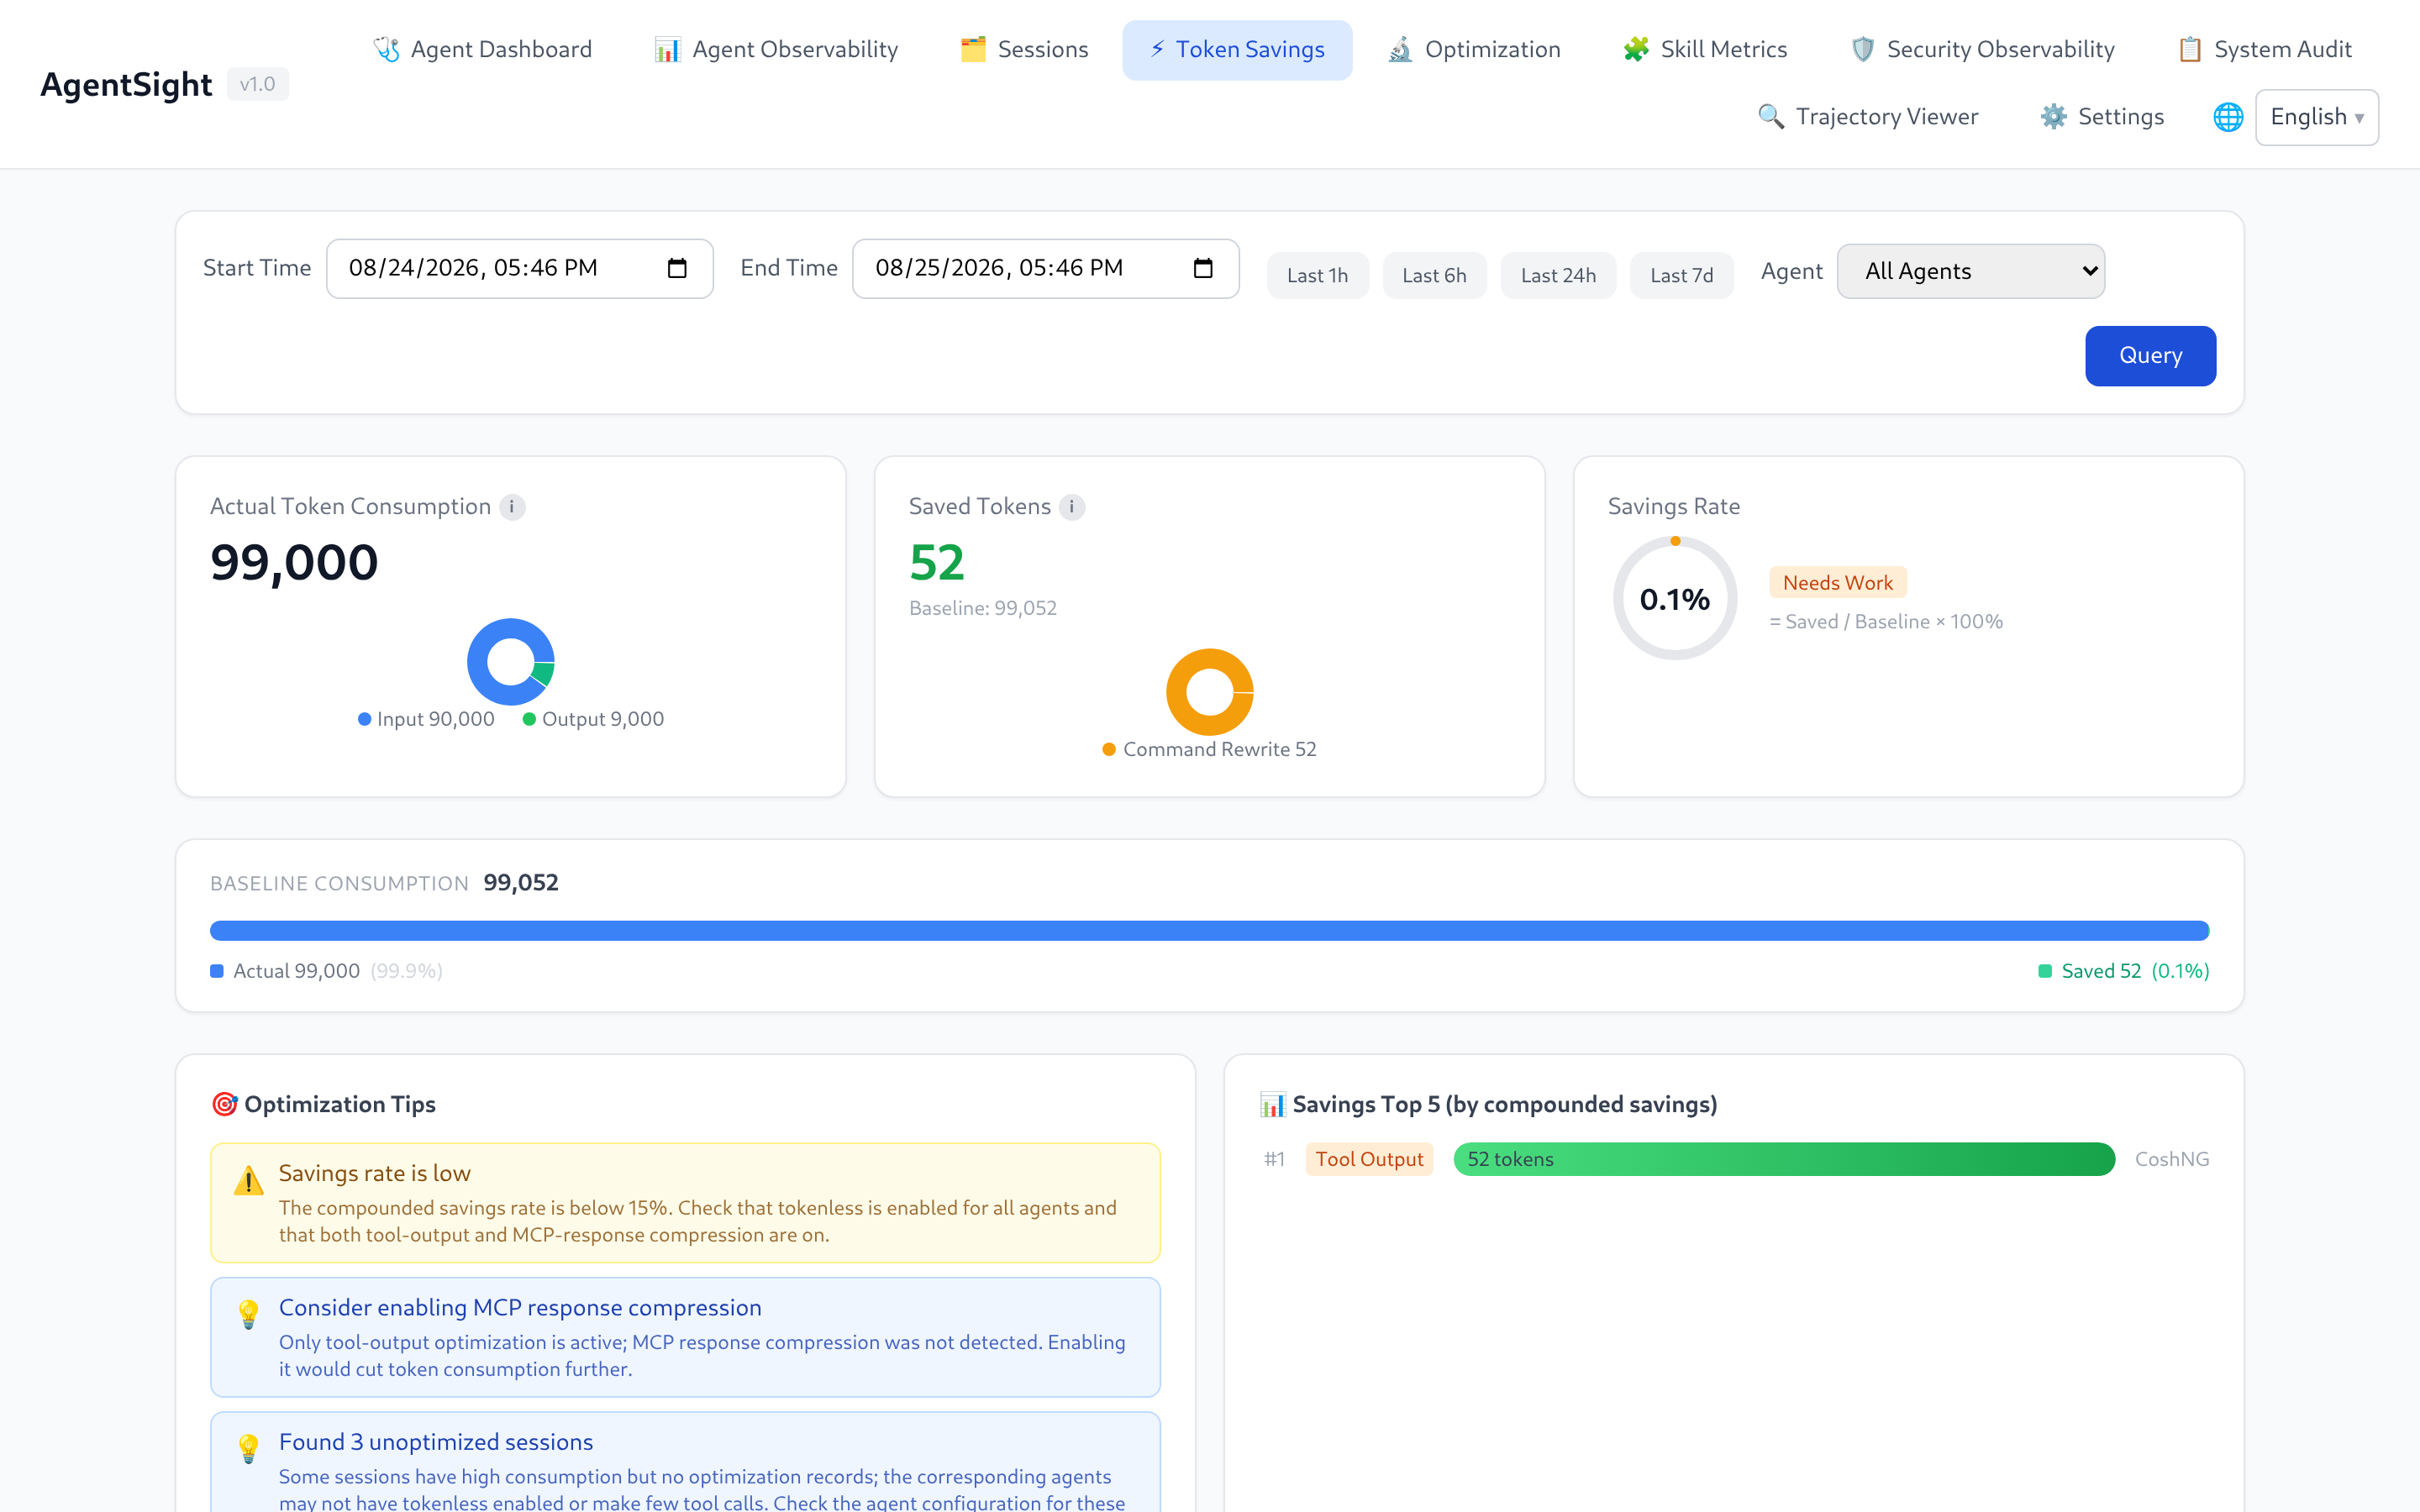
Press Query after choosing a range; the page starts empty on purpose. Setup: Integrations.
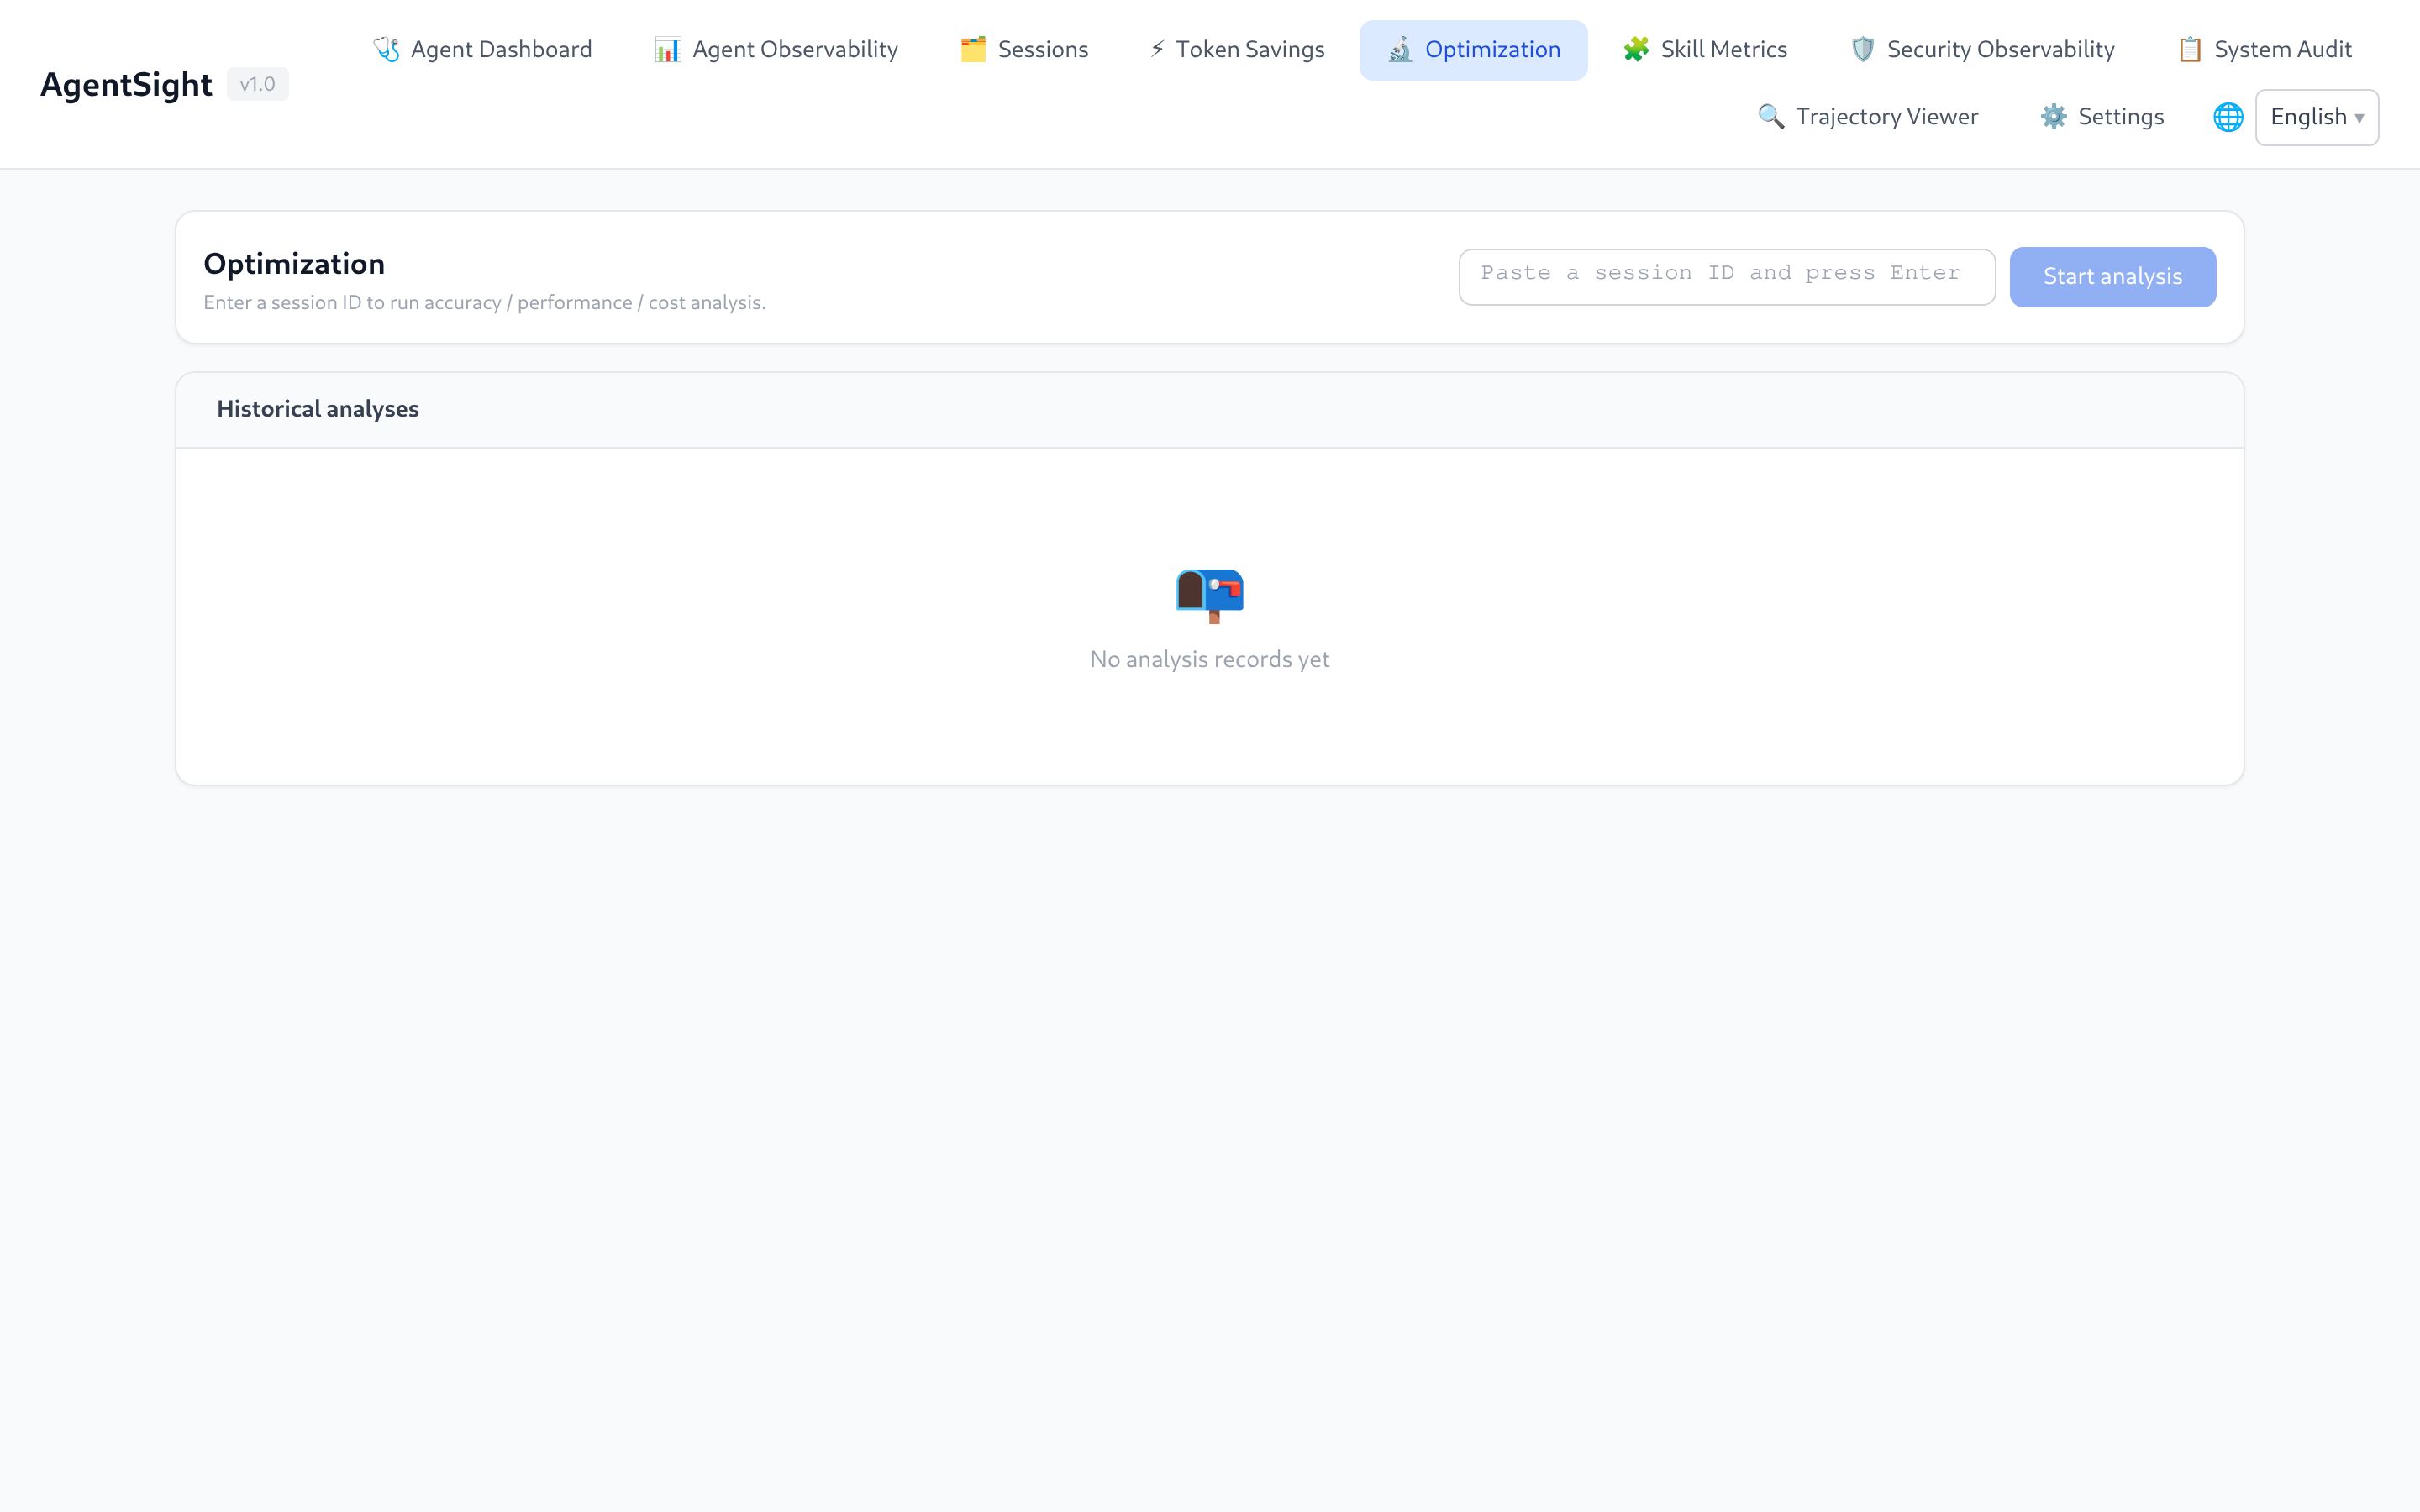
Optimization
Runs LLM-assisted analysis over one session in six dimensions: perf, perf-issues, cost,
cost-waste, accuracy, and summary. Analyses need an LLM configured on the Settings page and
take roughly 10–60 seconds; results are stored, so the page also lists earlier runs.
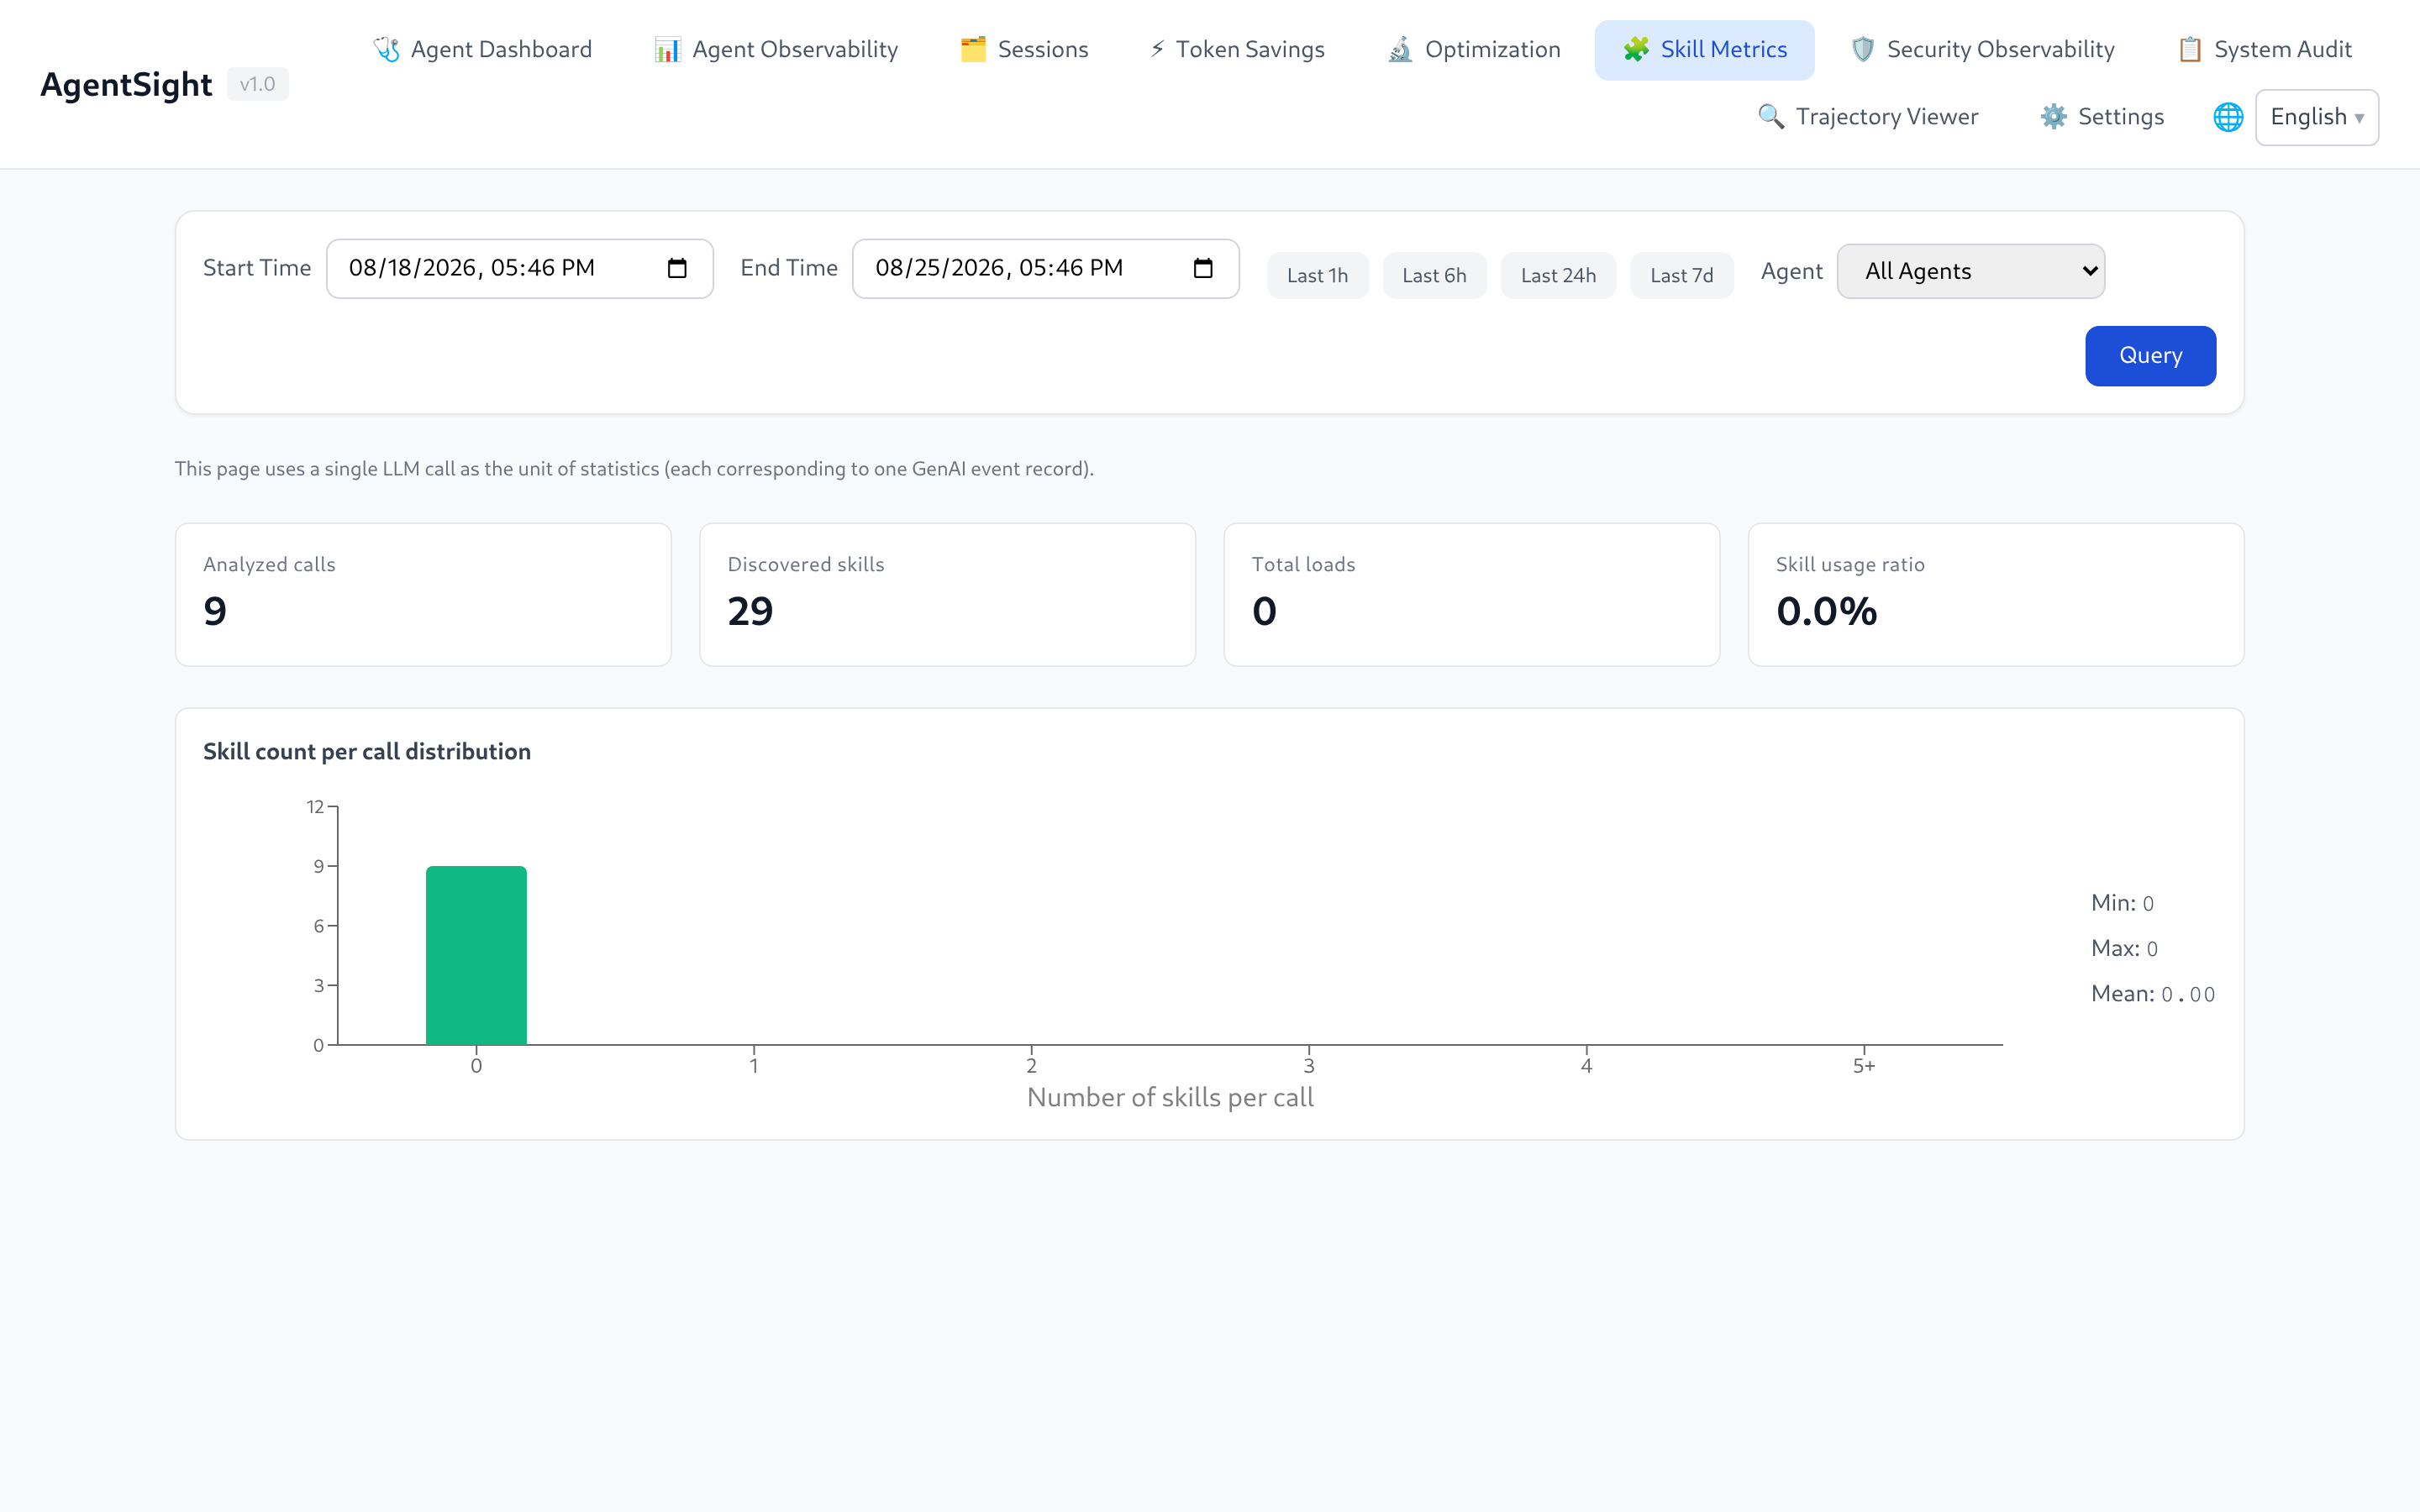
Skill Metrics
Skill adoption computed on demand from GenAI events: analyzed calls, discovered Skills, load counts, usage ratio, per-call distribution, and a weekly hotness ranking. The unit of counting is one LLM call.
Security Observability and System Audit
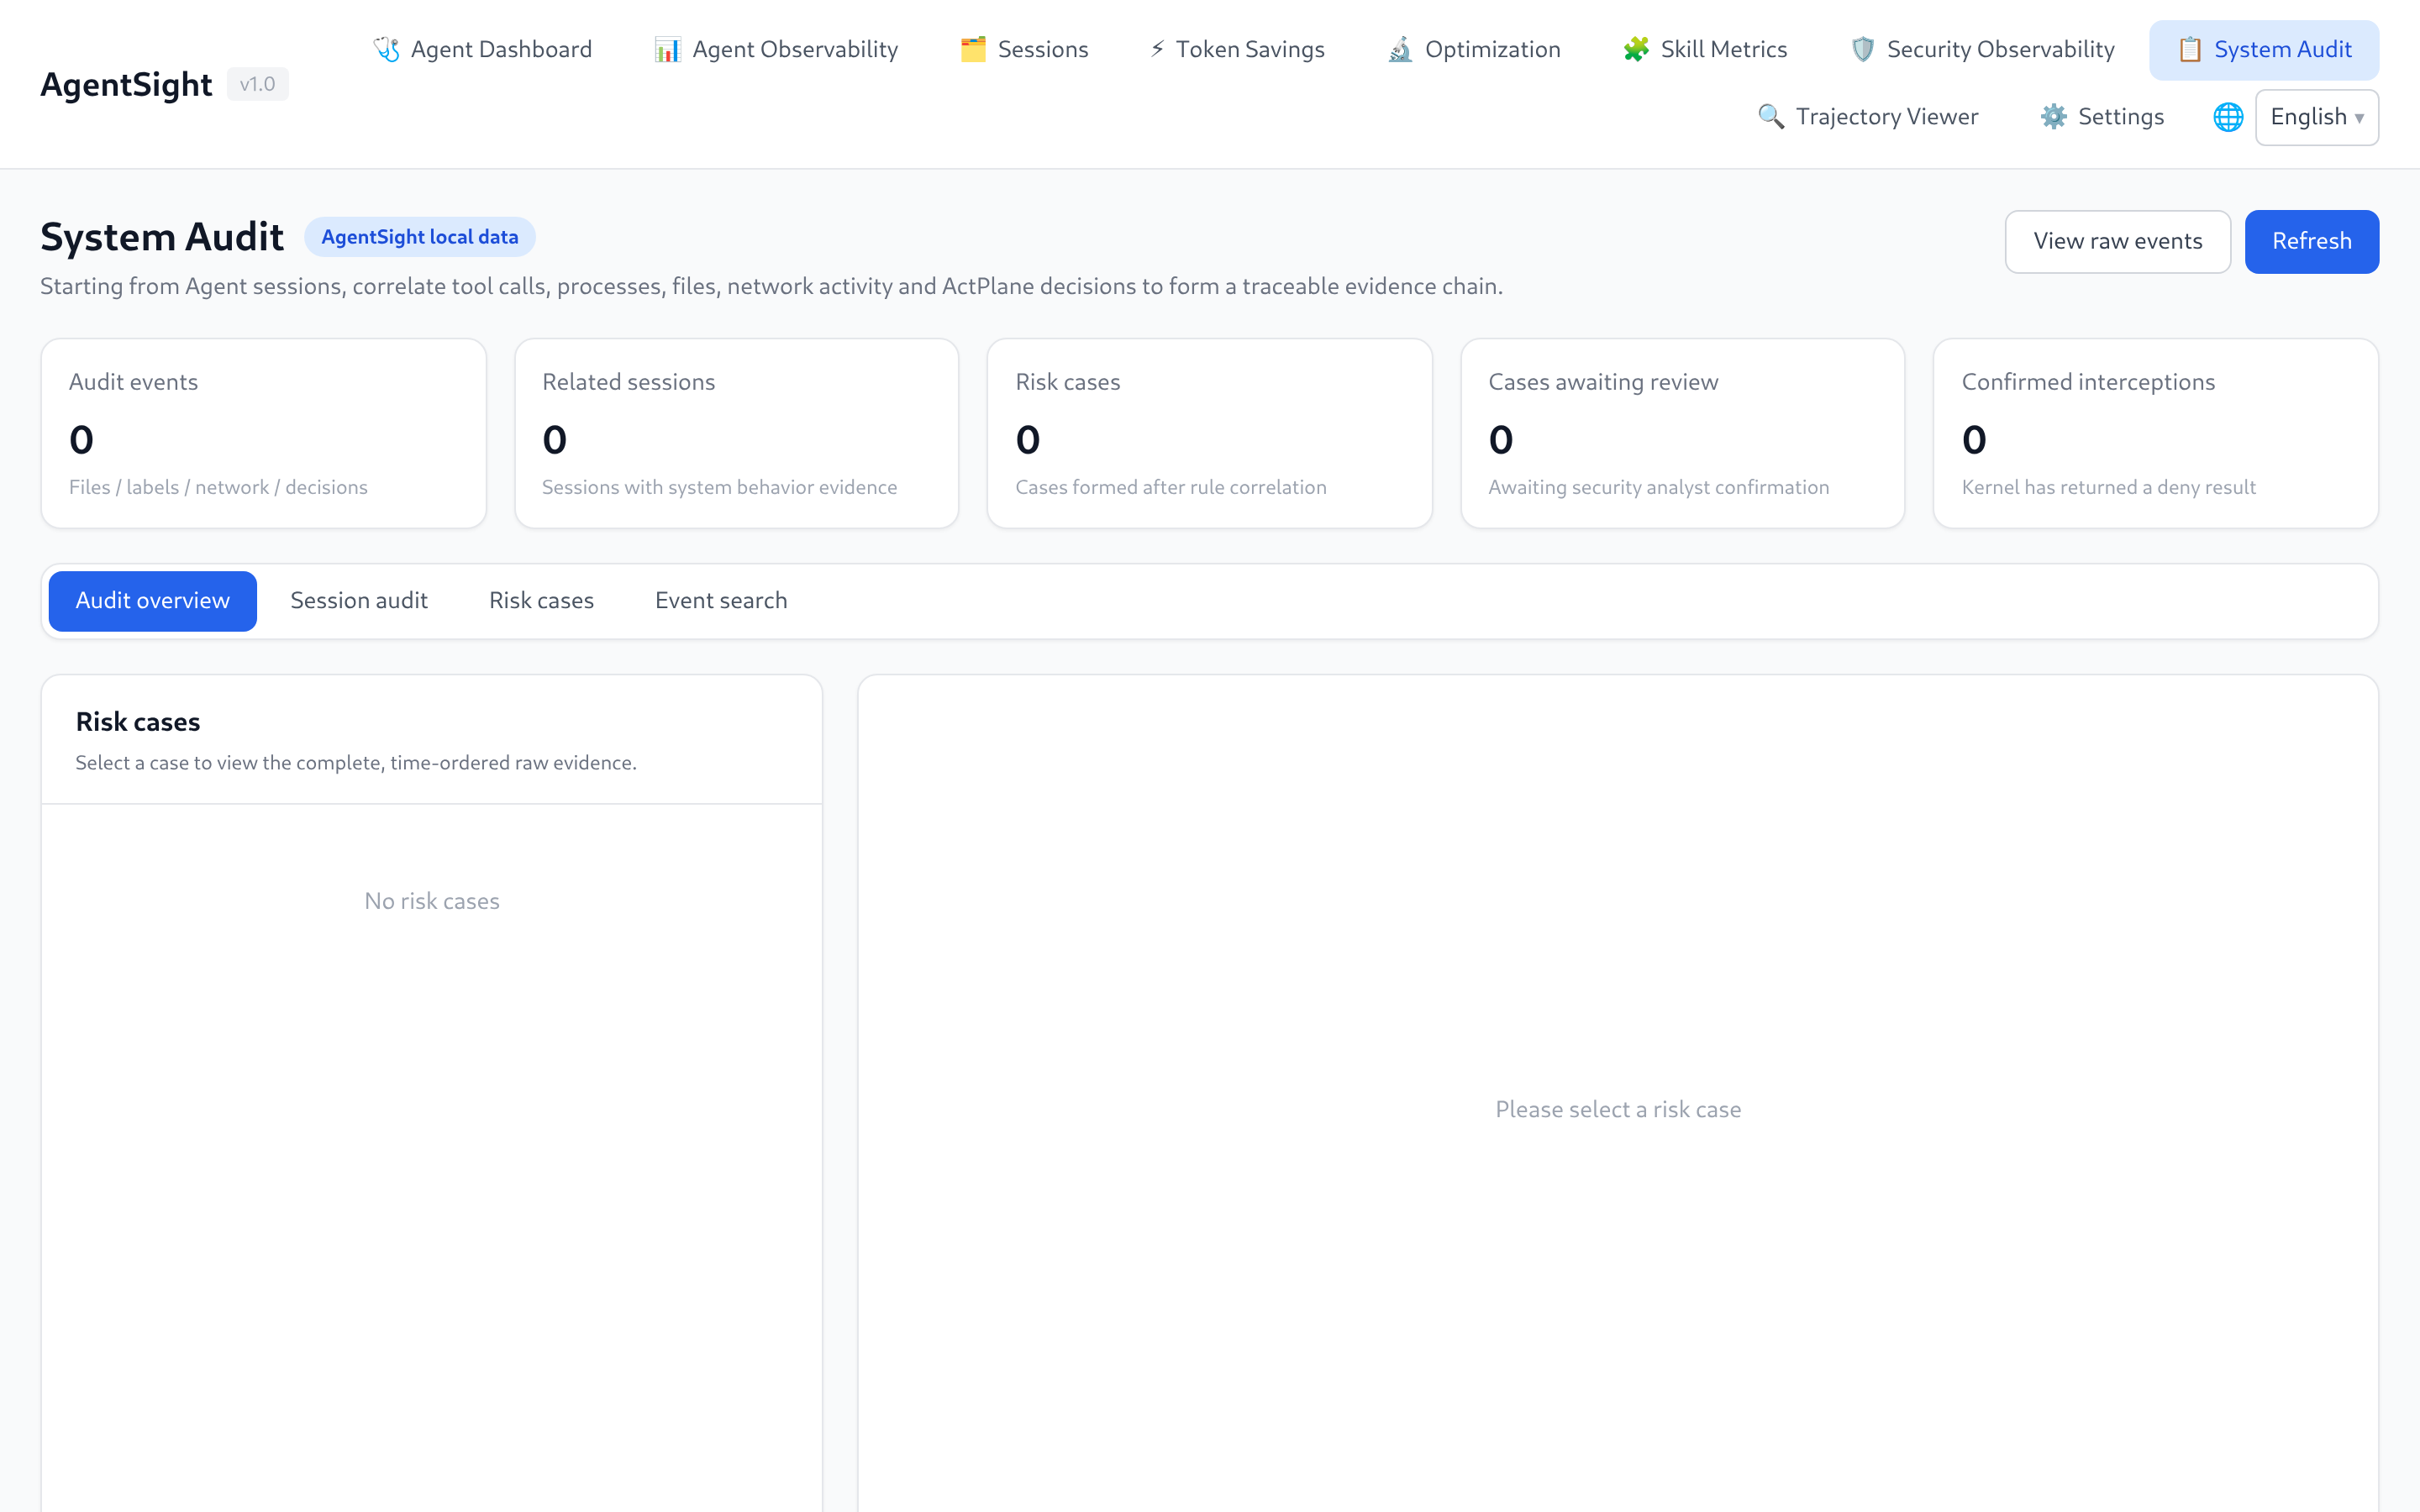
Present when agent-sec-core is installed. Security Observability shows scan verdicts (prompt injection, PII, code scanning) per session and run; System Audit aggregates audit events into cases you can review and, with the enforcer present, contain.
Trajectory Viewer
Loads any session or conversation as an ATIF v1.7 trajectory: Agent metadata, step and Token totals, Tokenless comparison, and the full interaction timeline — system preamble, each round, tool calls, and results. Download JSON exports the trajectory; Import JSON replays one captured elsewhere.
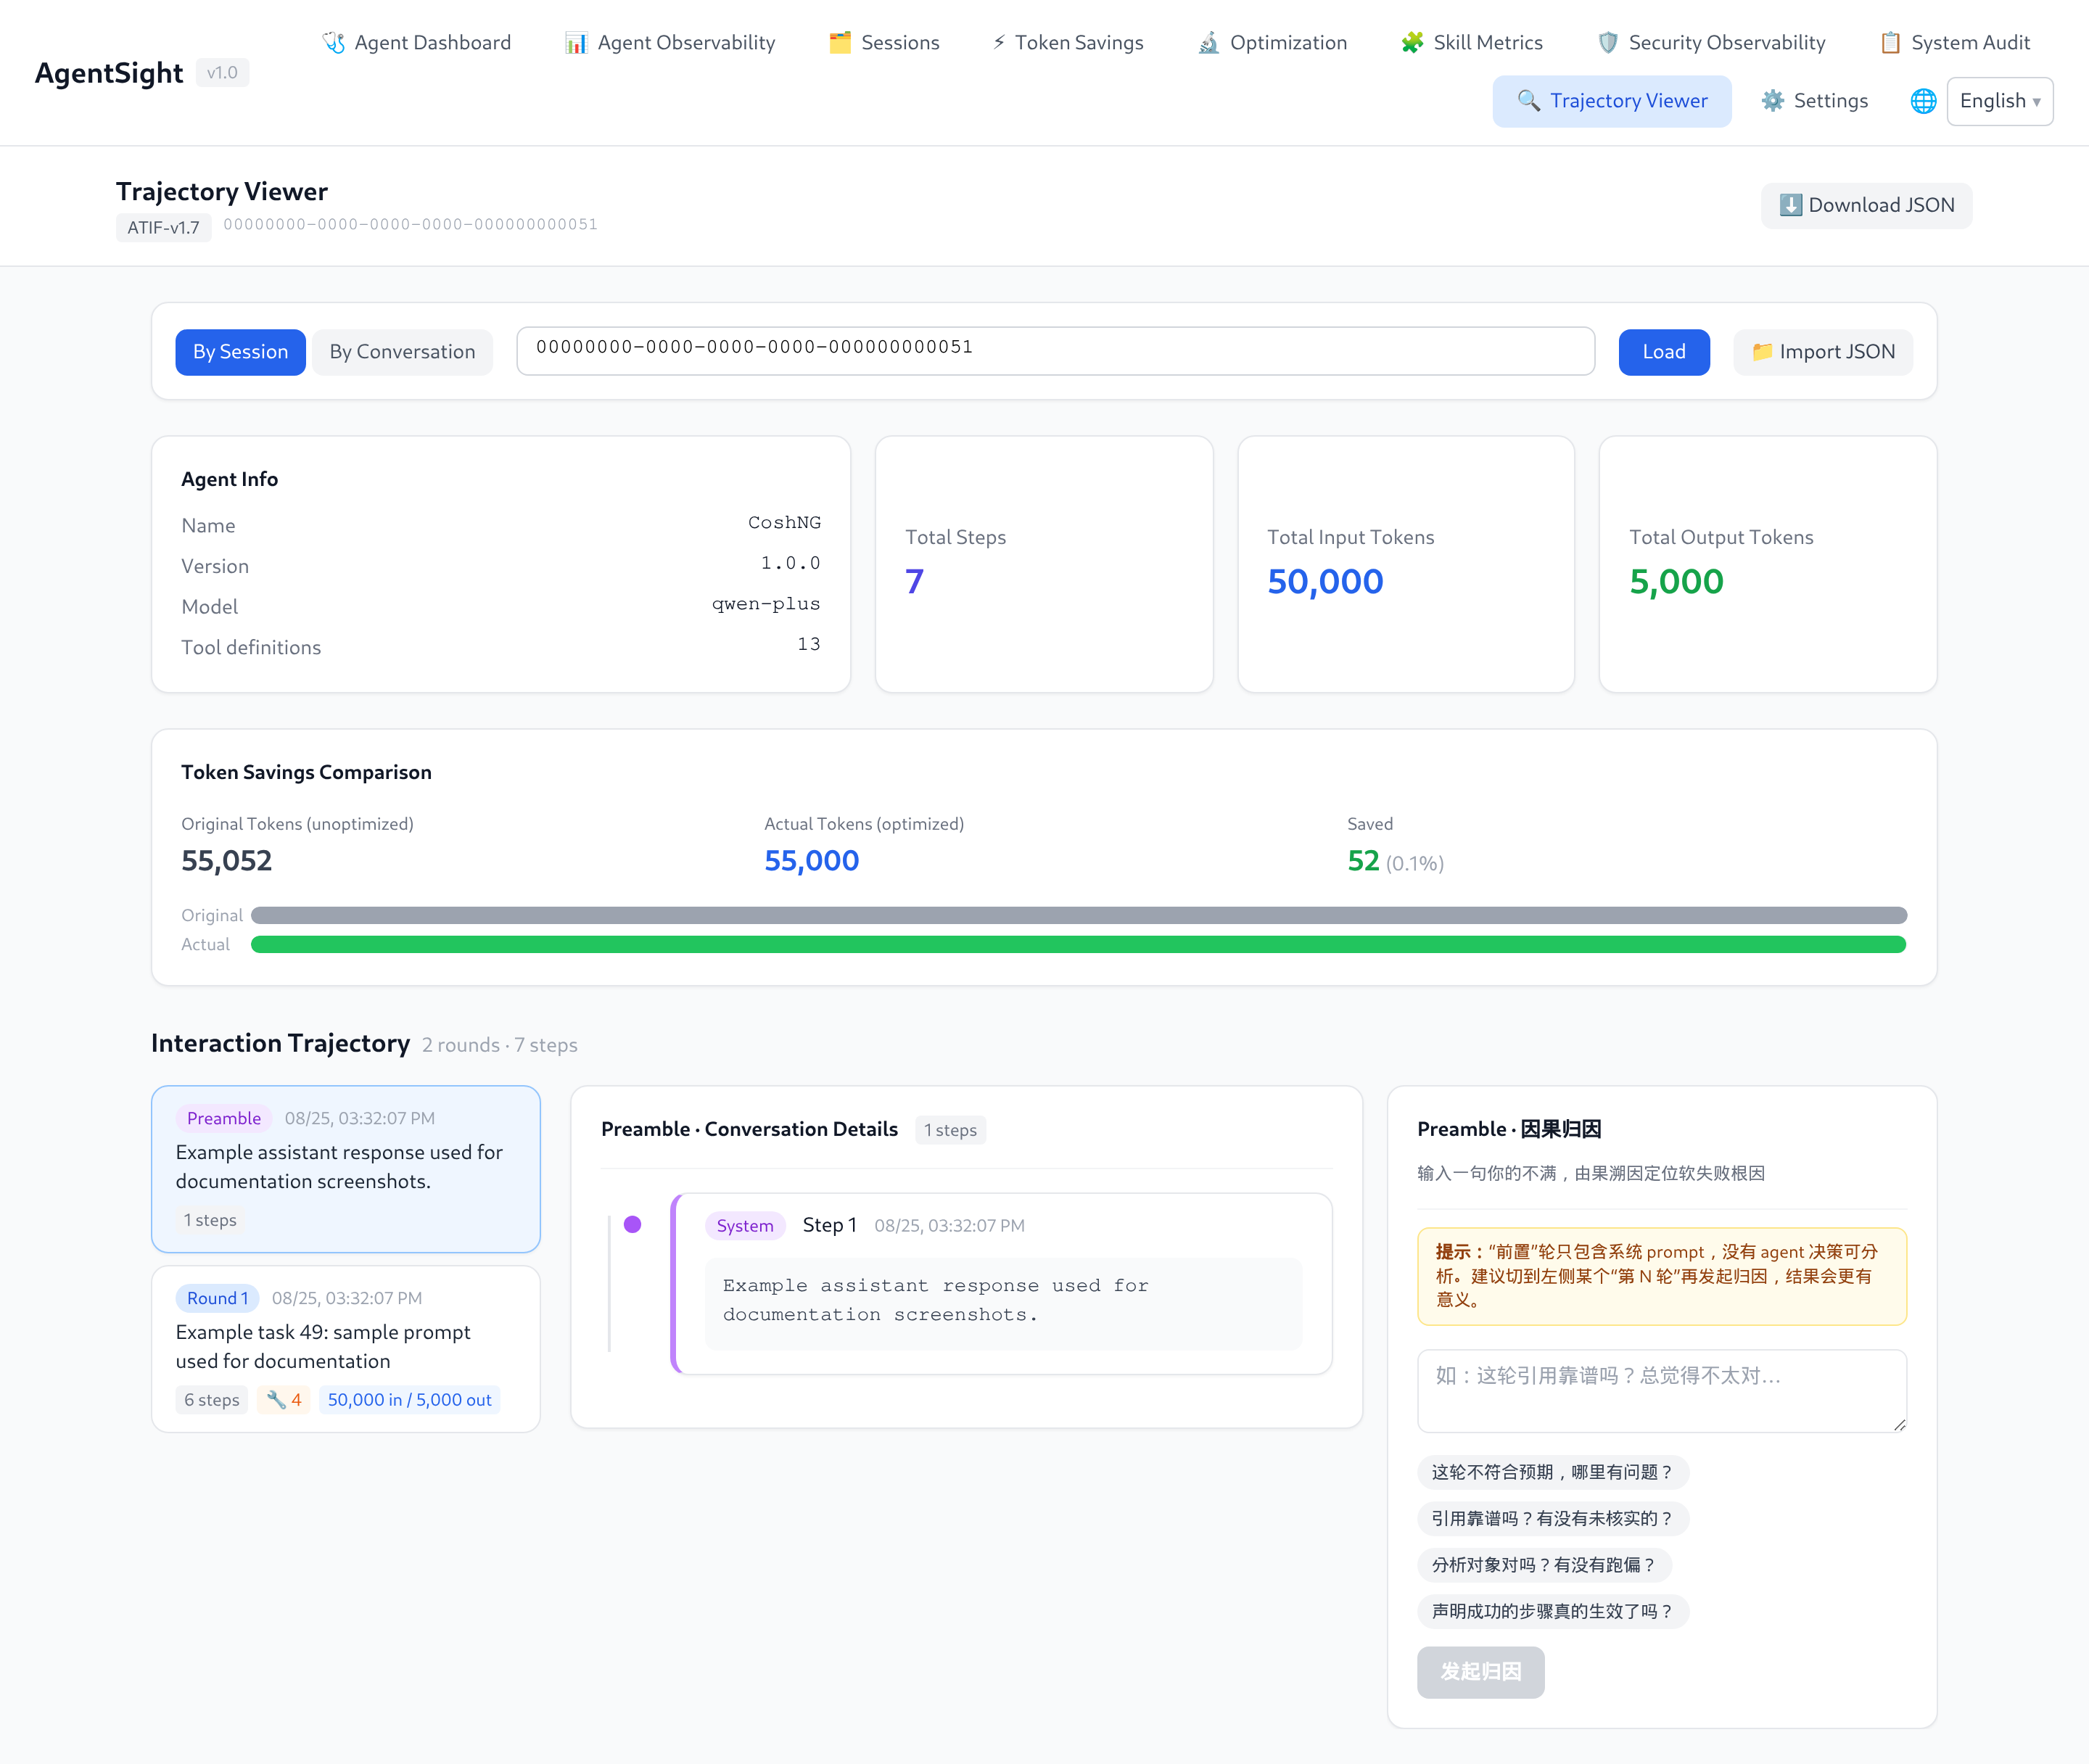
This is the page to open when you need to know exactly what the Agent sent and received.
Settings
The SQLite storage card shows each database's effective retention and size policy, physical and
logical usage, and whether cleanup is due. Logical usage excludes reusable freelist pages, so a
large physical file can still be within policy; the card does not claim that the background cleanup
worker is healthy. The data comes from authenticated GET /api/storage/status, which never exposes
filesystem paths.
This page also configures the LLM used by optimization and semantic search (provider, base URL,
model, API key, and the semantic-search ranking timeout). A timed-out ranking returns no results and
is recorded as a server warning. The key is masked when read back and stored in
optimization_config.json next to the databases.
Language
The UI follows the browser language and offers a manual switch in the top-right corner; the choice persists across reloads.
Query the API instead
Everything on these pages comes from the HTTP API, and the route list is served by the API itself:
curl -s http://127.0.0.1:7396/api/docs | python3 -m json.tool | head -30

# remote access needs the token
curl -s -H "Authorization: Bearer $TOKEN" http://<host>:7396/api/sessions
See Data and storage for the endpoint groups.
Related pages
- Interruption detection — what the badges mean
- Configuration — authentication switch
- Troubleshooting — 401, unreachable port, empty pages