AgentSight Quick Start
This page takes you from an empty machine to a Dashboard showing your own Agent traffic. The commands were verified on an Alibaba Cloud Linux 4 host (kernel 6.6) running AgentSight 0.11; the sample output keeps the real layout but uses placeholder IDs and round numbers, so nothing you see below is a real capture.
1. Check the prerequisites
uname -r                                  # kernel must be >= 5.8
ls /sys/kernel/btf/vmlinux                # BTF must exist
id -u                                     # tracing needs root (0) or CAP_BPF
If /sys/kernel/btf/vmlinux is missing, the kernel was built without BTF and the eBPF probes
cannot load. Use a kernel with CONFIG_DEBUG_INFO_BTF=y.
2. Install
# Recommended: system mode, because eBPF needs root
sudo anolisa install agentsight

# Alternative on Alibaba Cloud Linux / Anolis with the repo configured
sudo yum install agentsight

# Developers building from source
cd src/agentsight && make build-all
Use
make build-allfor source builds. It builds the Dashboard frontend, the main binary, andagentsight-enforcerin that order. Plainmake buildskips the enforcer, andservethen logsAgentSight enforcement unavailableon every start.
3. Start the service
sudo systemctl enable --now agentsight.service
systemctl is-active agentsight.service
The packaged unit starts a supervisor that runs both workers: agentsight trace (eBPF capture)
and agentsight serve --host 0.0.0.0 (API + Dashboard). It also pulls in
agentsight-enforcer.service when that package is installed.
Data is written to /var/log/sysak/.agentsight with a private umask, so CLI queries against
service-owned data need sudo.
4. Produce some traffic
AgentSight only records processes it recognises as Agents, so run an Agent task. Any supported Agent works — cosh, Claude Code, Codex, Qwen Code, OpenClaw, Hermes, AgentScope. Example with cosh-ng in headless mode:
cosh-core --headless --approval-mode trust "explain what load average means in one sentence"
Confirm the process was recognised while it runs:
$ sudo agentsight discover
已发现 AI Agent(共 1 个):
============================================================

  CoshNG [PID: 10000]
    类别: custom
    命令:  /usr/libexec/anolisa/cosh-ng/cosh-shell ...

总计: 1 个 Agent
discoverandtokenprint in Chinese regardless of locale.tokenhas a--jsonflag for language-neutral output;discoverdoes not, so parse its text or query/api/agent-healthwhen you need machine-readable discovery data.
5. Check that data landed
$ sudo agentsight summary --last 24
AgentSight Summary (last 24h)

Sessions      10
  Tokens      100.0K in / 10.0K out / 110.0K total

Interruptions 1
  critical    0
  high        0
  medium      1
  low         0

Tokenless     10% saved (110.0K -> 99.0K, 20 ops)
summary is the fastest health check: sessions and Tokens, interruptions grouped by severity, and
Tokenless savings if that component is installed. Each data source degrades on its own — a missing
database contributes zeros instead of failing the whole report.
6. Open the Dashboard
$ sudo agentsight dashboard --no-open

AgentSight 仪表盘状态
=====================

  认证:    已启用
  本机:    http://127.0.0.1:7396 (无需认证)
  局域网:   http://192.168.1.10:7396/?token=<TOKEN>
  公网:    http://203.0.113.10:7396/?token=<TOKEN>
- From the same host, open
http://127.0.0.1:7396— loopback access skips authentication. - From your laptop, use the printed URL including
?token=…, and make sure the firewall or security group allows TCP 7396.
Without a valid token the Dashboard shows the login screen:
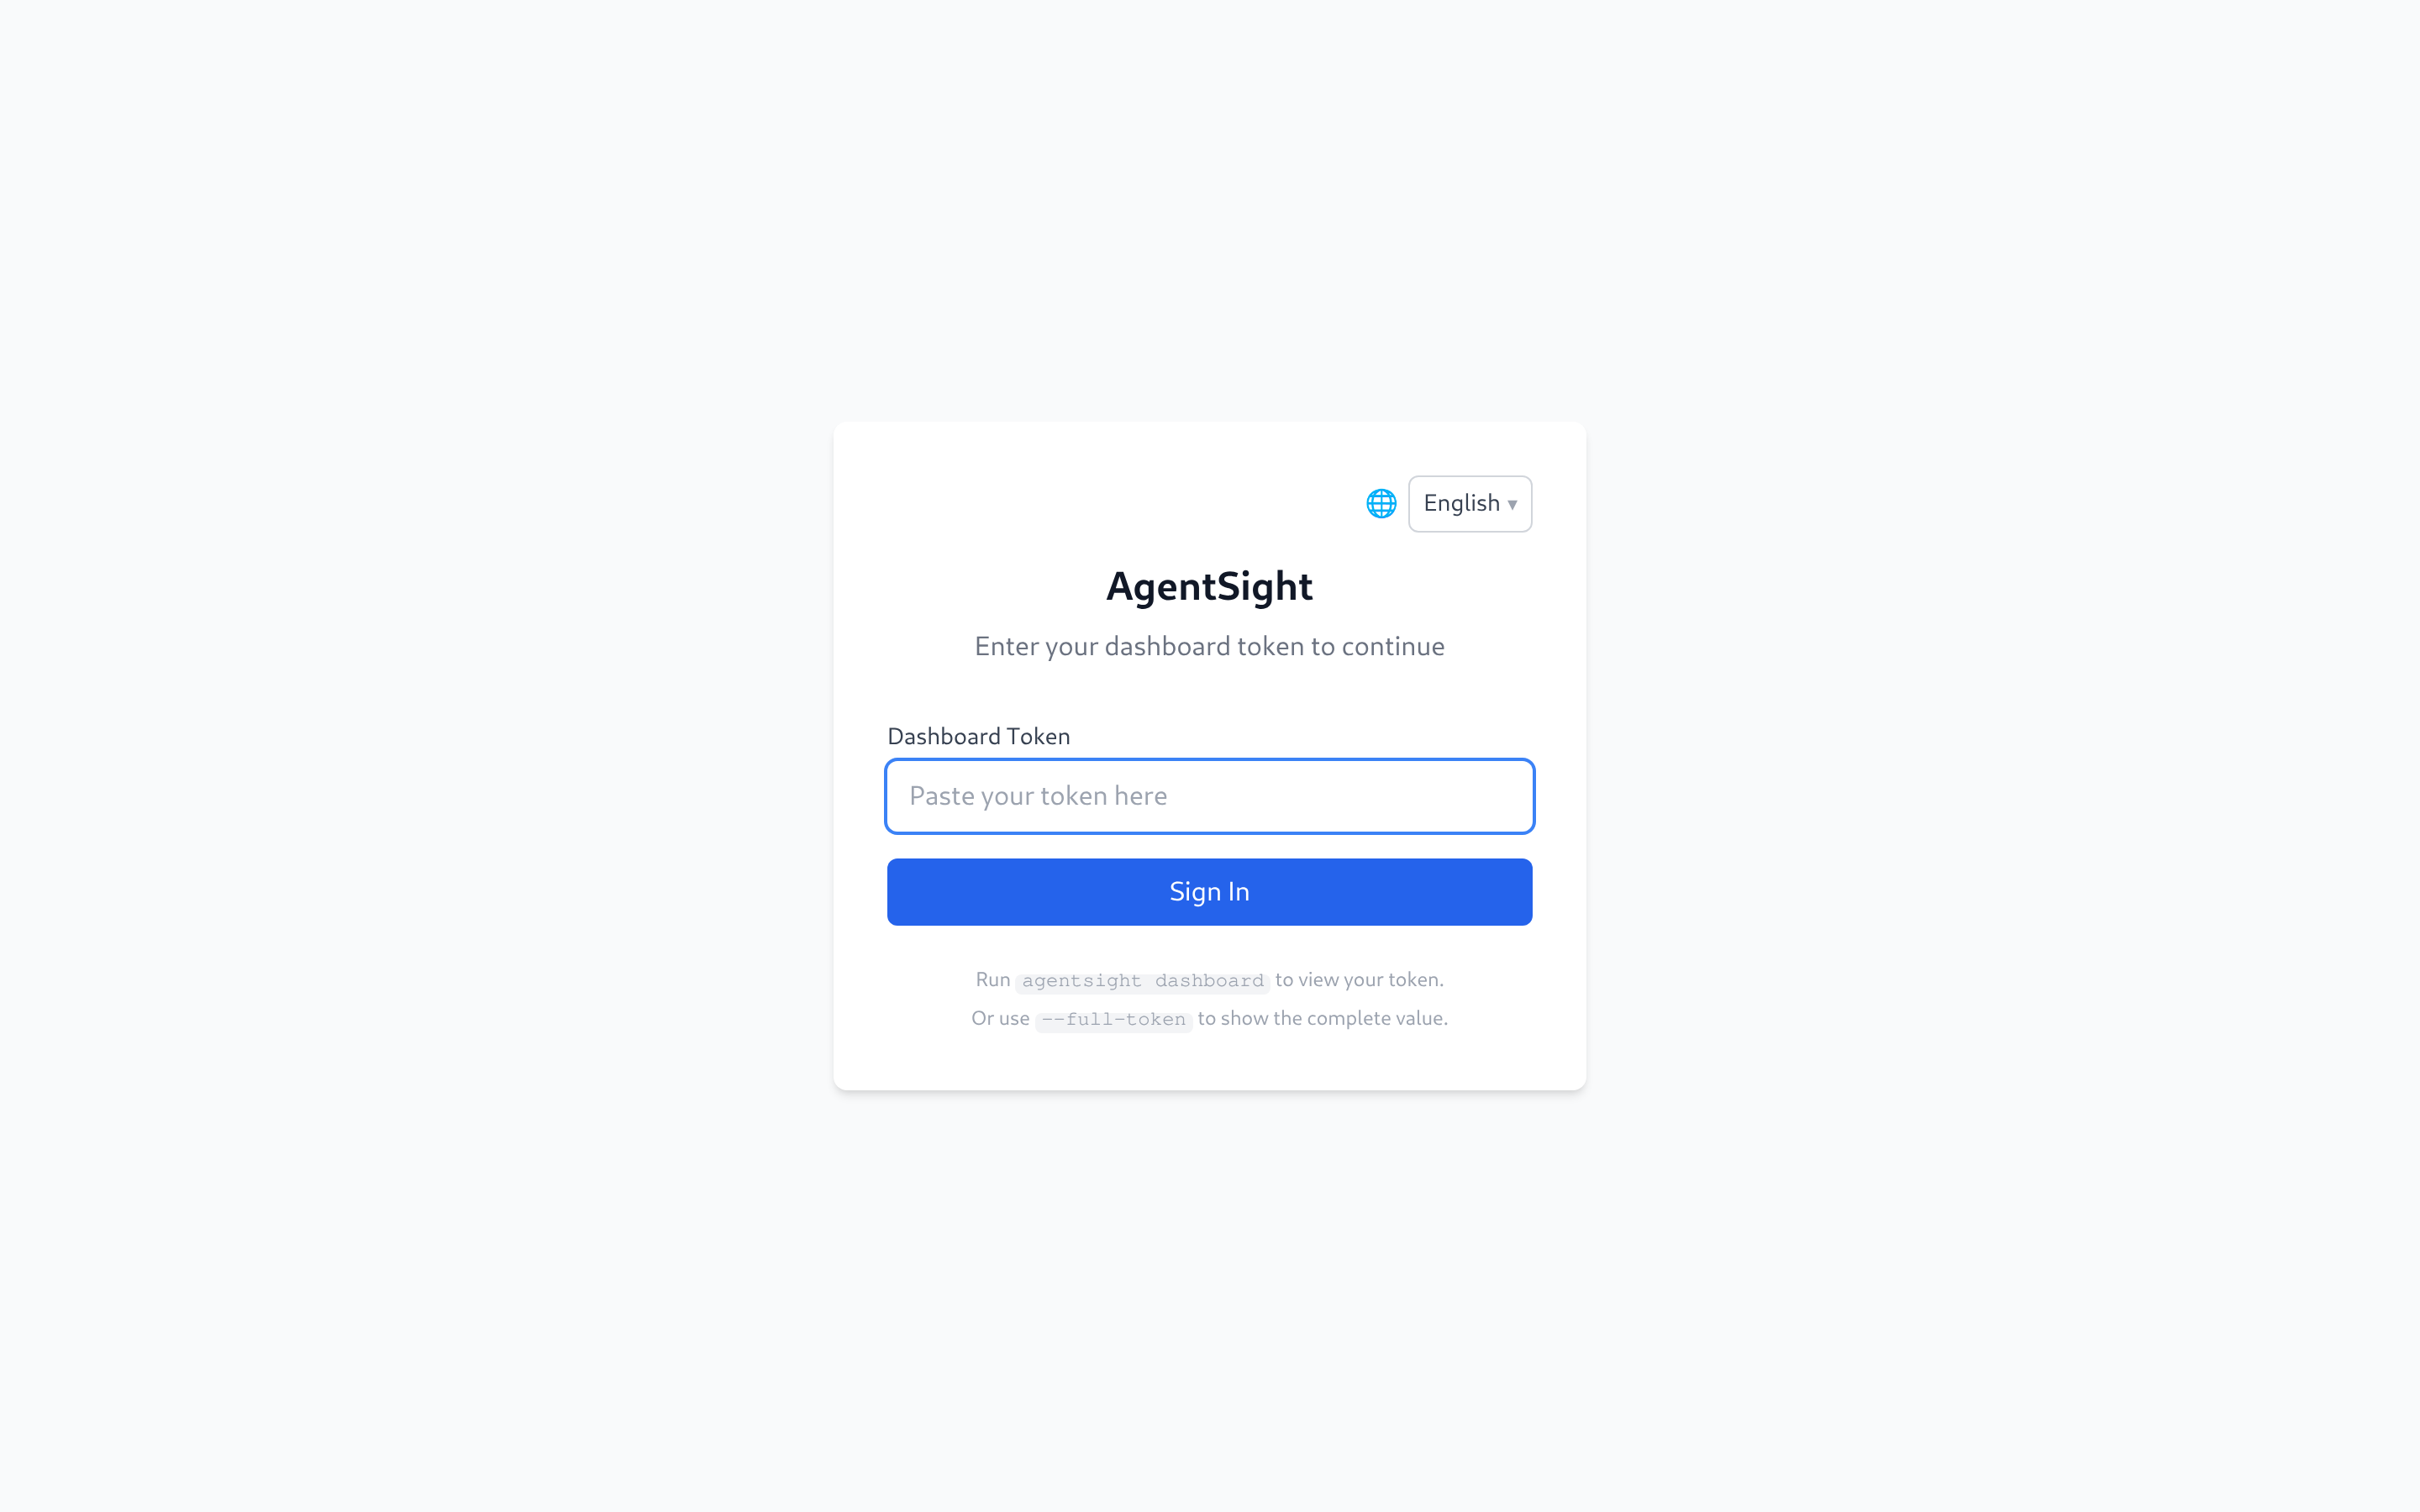
Paste the token from agentsight dashboard --no-open and you land on the Agent Dashboard
(http://127.0.0.1:7396/#/health) — live Agent health plus the unresolved interruption inbox.
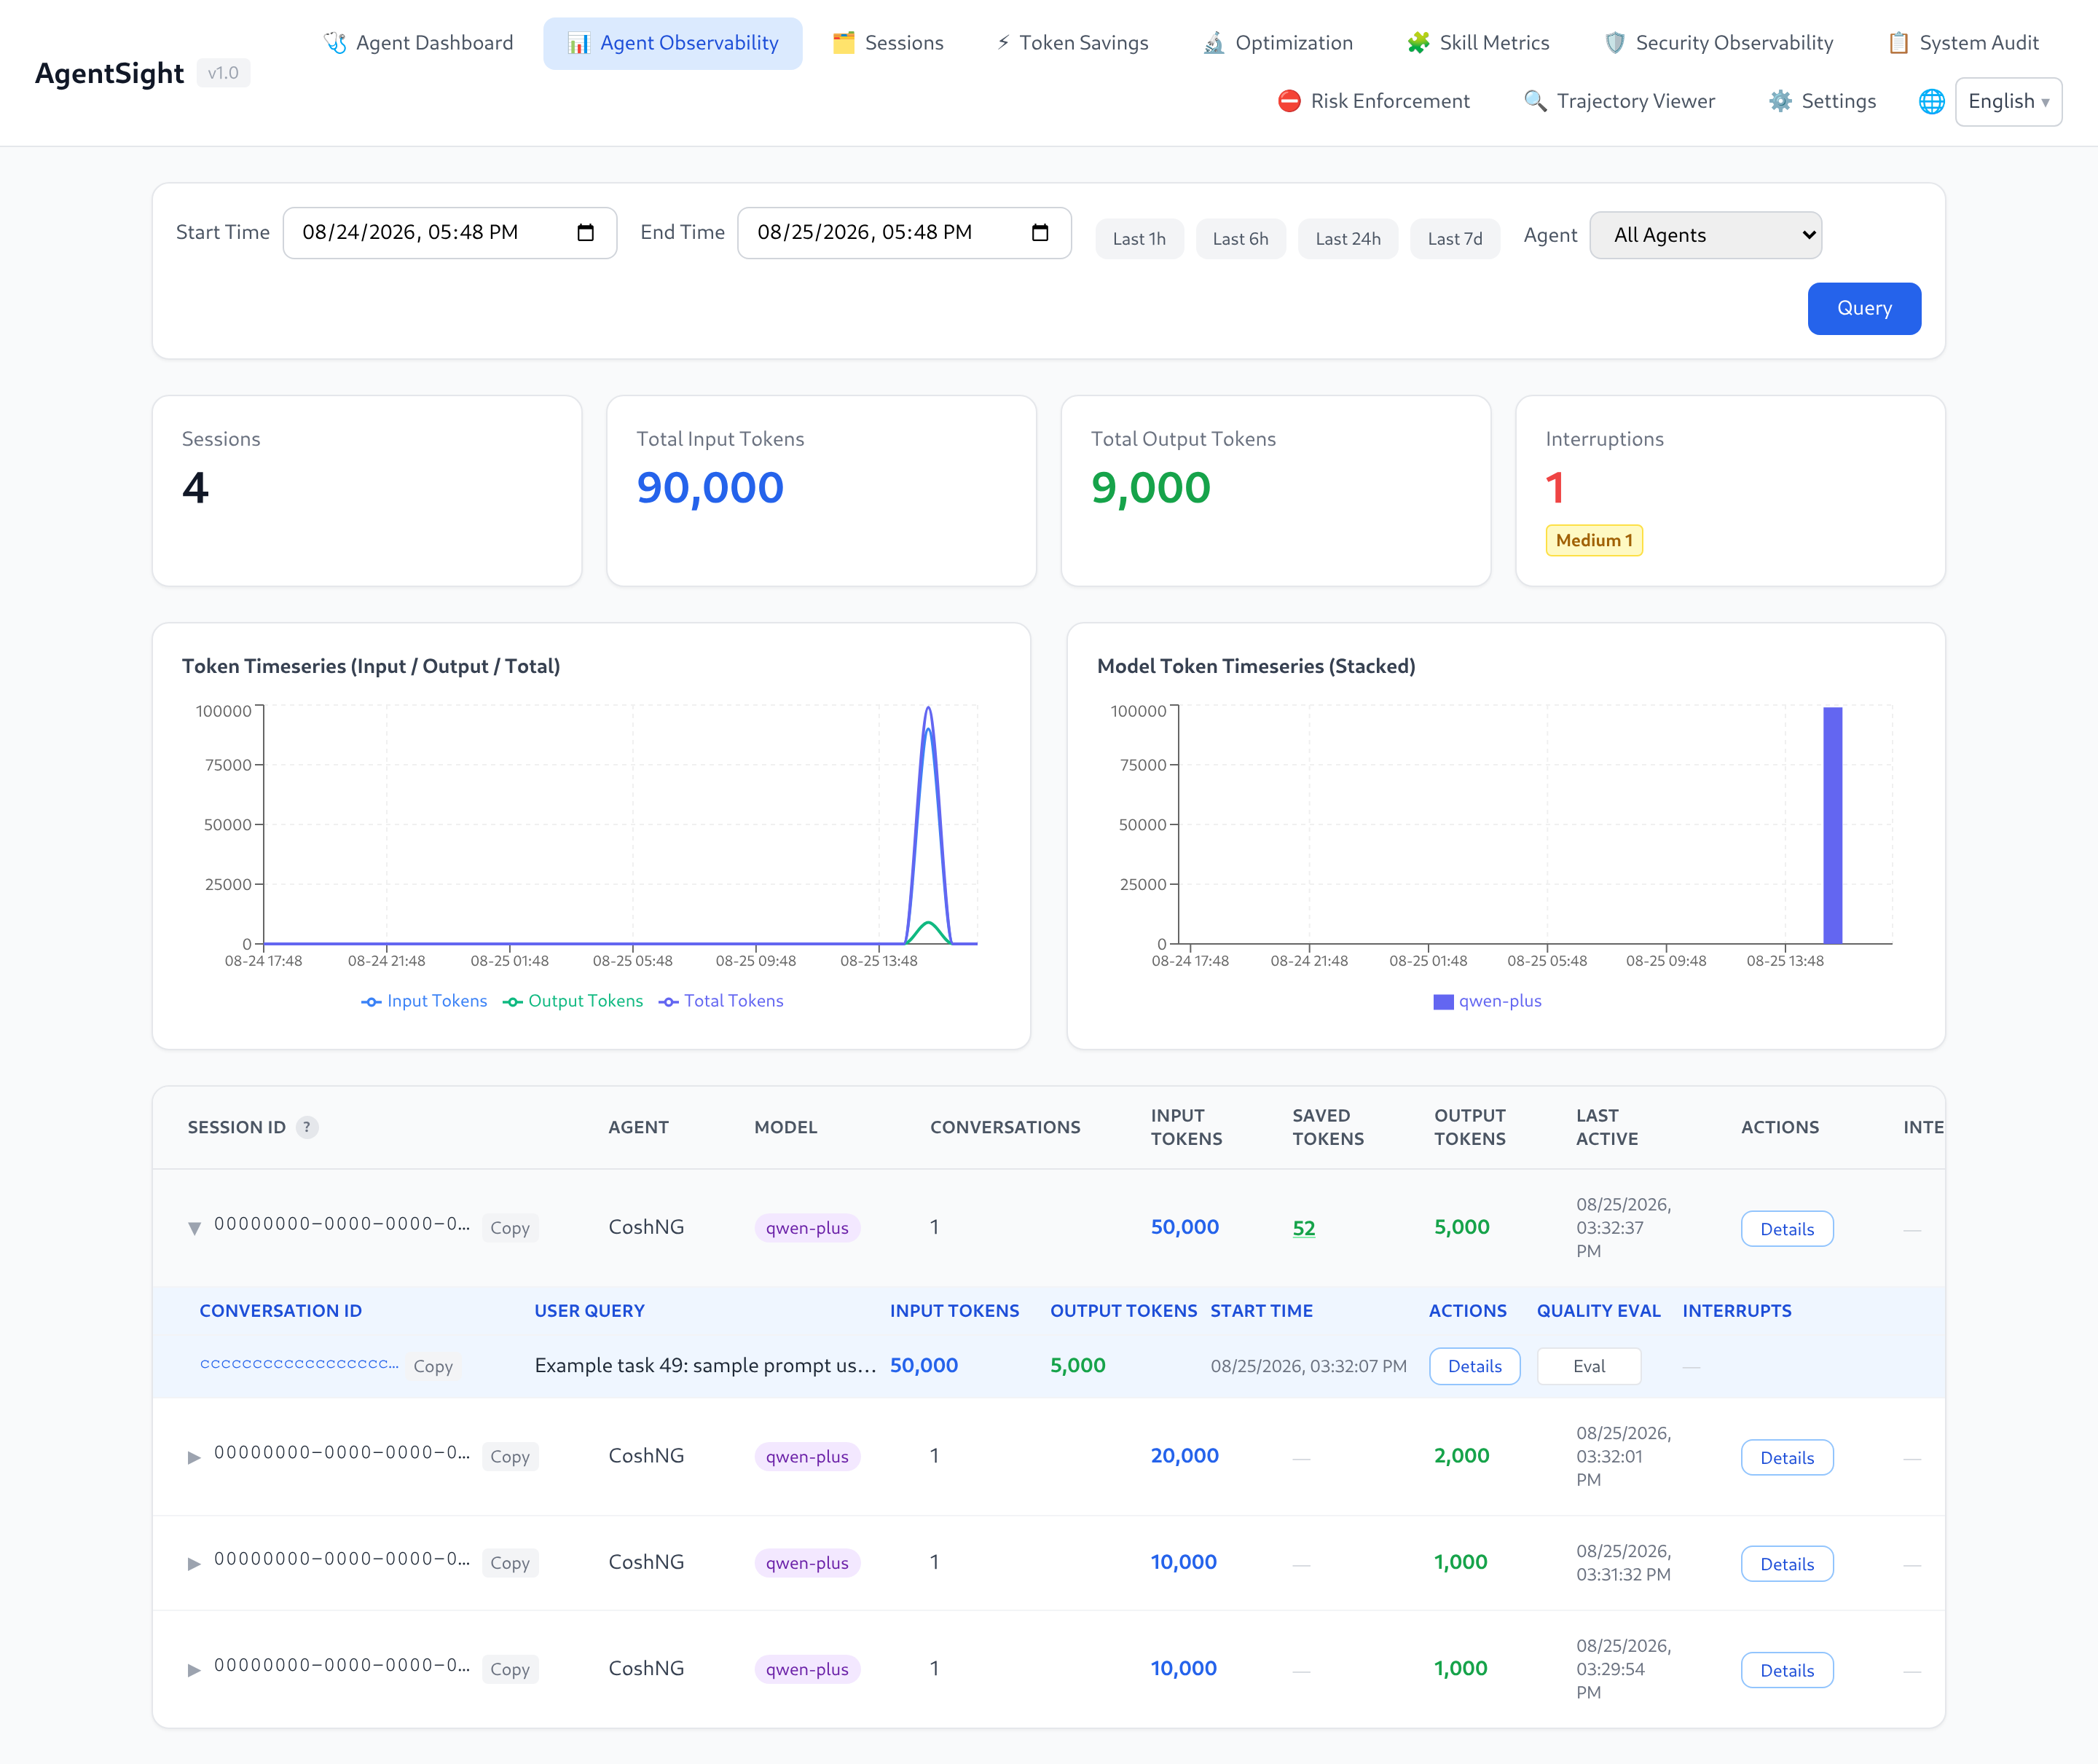
The session analysis page keeps an address of its own: pick Agent Observability in the
navigation bar, or open http://127.0.0.1:7396/#/observability directly. It lists sessions with
their Token totals and interruption badges; clicking a row expands the conversations inside that
session:
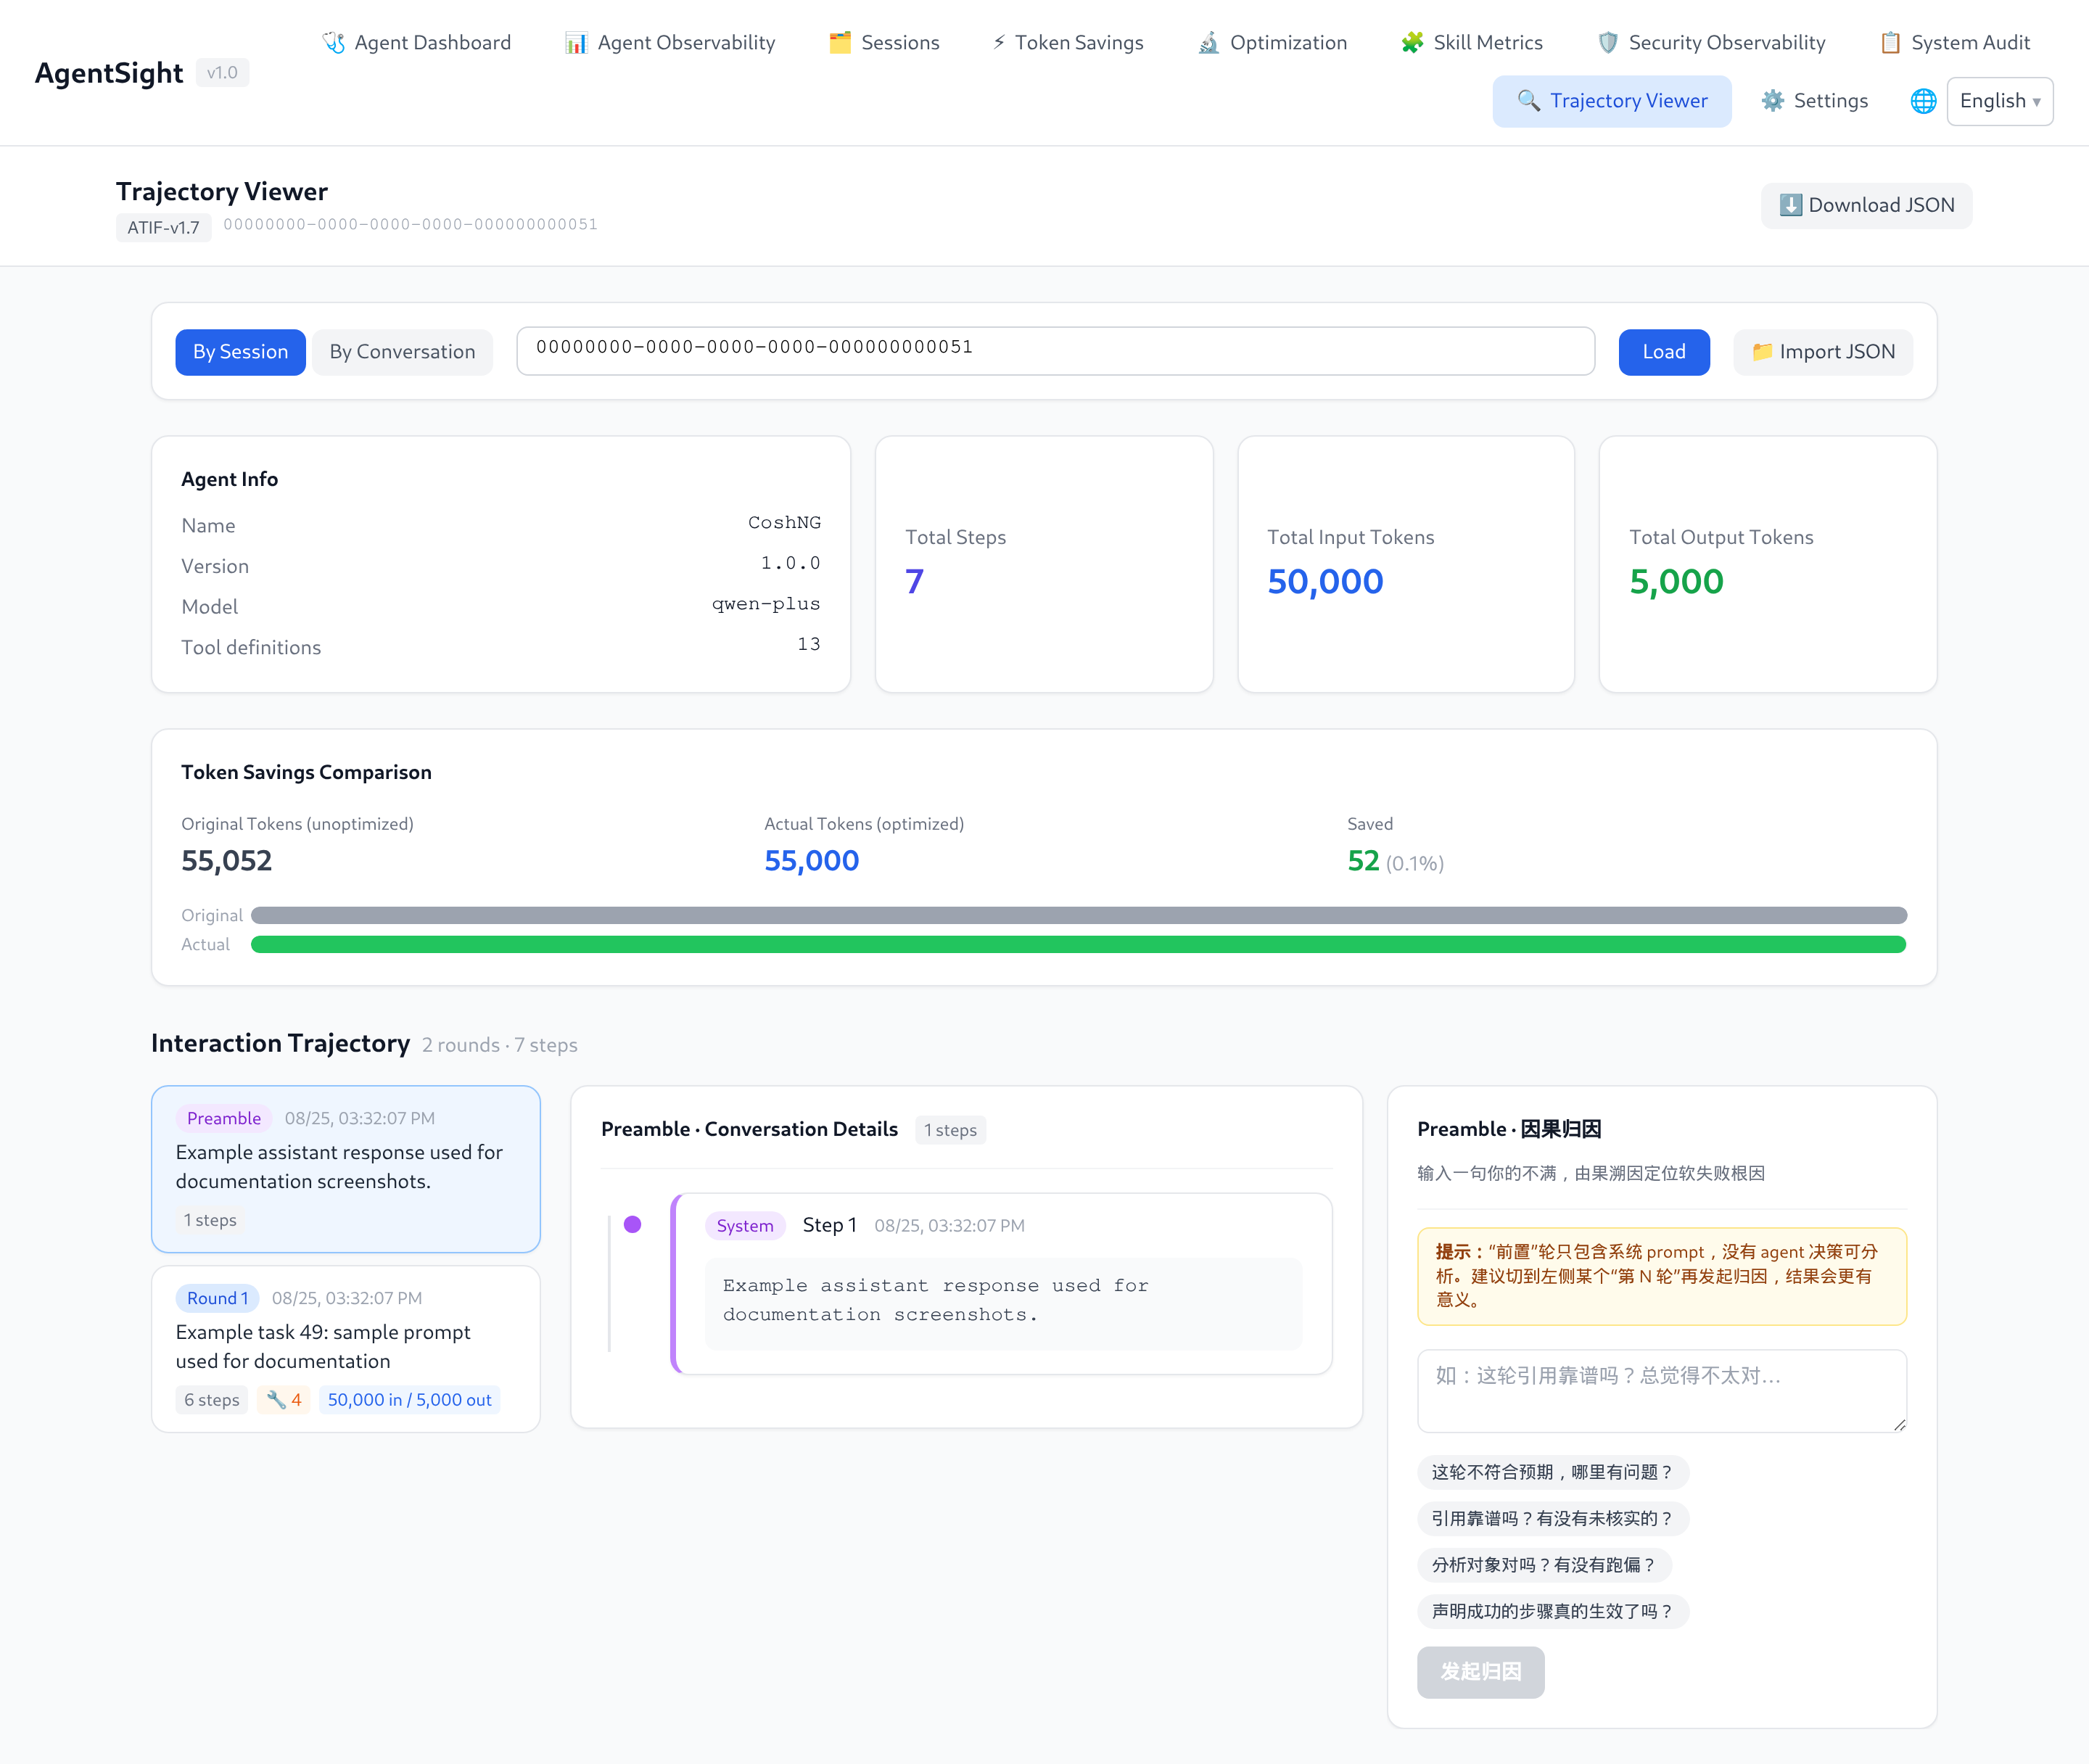
Use Details on any row to open the step-by-step trajectory of that session or conversation:
7. Know where things live
| Item | Path |
|---|---|
| Binary | /usr/local/bin/agentsight |
| Configuration | /etc/agentsight/config.json |
| Databases and Dashboard token | /var/log/sysak/.agentsight/ |
| systemd units | agentsight.service, agentsight-enforcer.service |
| Default Dashboard port | 7396 |
Next steps
- Your Agent is not detected → Agent discovery rules
- A task failed or hung → Interruption detection
- You want every flag → CLI reference
- You want the Dashboard tour → Dashboard guide
- Nothing shows up at all → Troubleshooting